Recombinant Uricase Production Overview
Expression systems, purification strategy, PEGylation integration, and manufacturing control points for pegloticase development
Overview of Recombinant Uricase Manufacturing
The production of Pegloticase, Recombinant Uricase starts with host selection, but successful manufacturing depends on the coordination of expression, fermentation, purification, PEGylation, and final quality control. Because uricase is a non-glycosylated enzyme, bacterial systems remain especially attractive for commercial production, provided the process can consistently control product folding, endotoxin burden, and aggregate content.
From a manufacturing perspective, the critical challenge is not only generating high volumetric yield, but also preserving enzymatic activity while controlling heterogeneity introduced during PEG conjugation and downstream polishing. A robust process therefore combines scalable upstream productivity with highly selective downstream purification and analytical release testing.
recombinant uricase production, protein expression uricase, uricase purification, biologics manufacturing enzyme, expression systems, purification methods, PEGylation integration, quality control
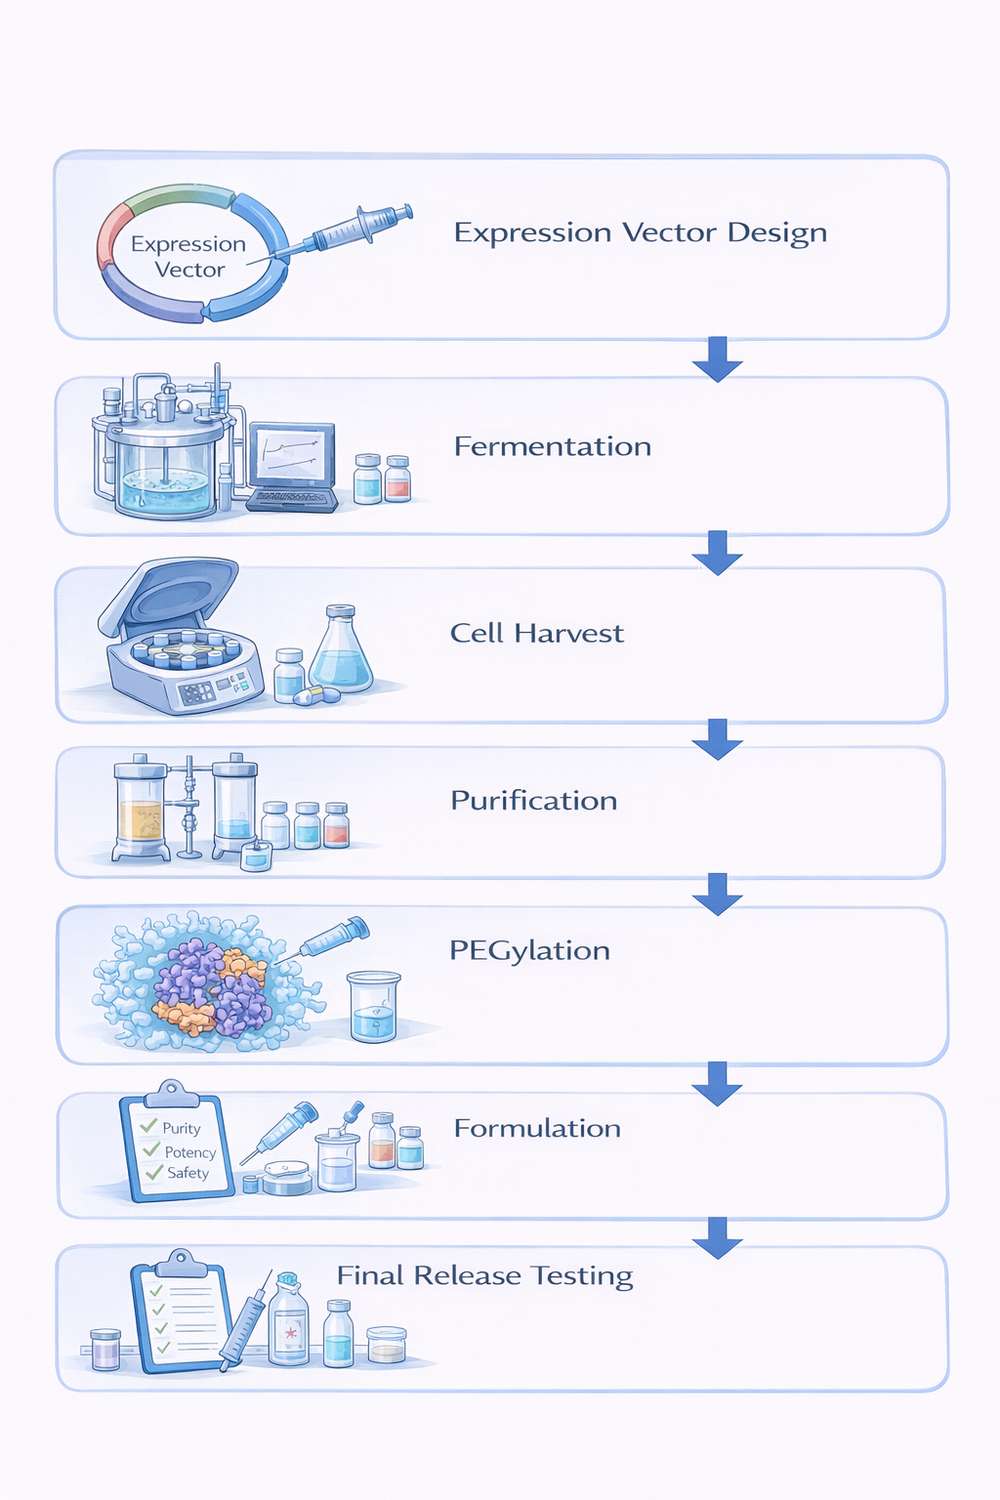
Fig 1. Recommended overview graphic for recombinant uricase manufacturing stages.
1. Expression Systems and Vector Design
The choice of expression system strongly affects manufacturing cost, scale-up behavior, and product quality. For pegloticase, Escherichia coli remains the leading platform because uricase does not require complex glycosylation and because bacterial manufacturing offers strong regulatory familiarity and favorable economics.
1.1 Why E. coli Is Commonly Preferred
- High expression levels and strong scalability in fed-batch fermentation
- Well-characterized host genetics and established industrial workflows
- No animal-derived expression background
- Lower media and infrastructure cost relative to mammalian systems
- Good fit for a non-glycoprotein enzyme such as uricase
1.2 Key Expression Considerations
Even in a bacterial host, soluble and active uricase production is not automatic. Process designers must consider inclusion body risk, correct folding, disulfide environment when relevant, and the need for stringent endotoxin removal during downstream processing.
| System | Host | Typical Yield | PTM Capability | Cost / Complexity | Manufacturing Implication |
|---|---|---|---|---|---|
| Bacterial | E. coli | High | Minimal | Low / Moderate | Best overall fit for non-glycosylated uricase |
| Yeast | Pichia pastoris, S. cerevisiae | High | Simple glycosylation | Moderate / Moderate | Useful alternative when secretion is advantageous |
| Mammalian | CHO, HEK293 | Moderate | Complex glycosylation | High / High | Often unnecessary for uricase but may support specialized designs |
| Insect | Sf9, High Five | Moderate | Variable glycosylation | Moderate / Moderate | Bridge option for some research-stage programs |
| Cell-free | E. coli lysate systems | Variable | Minimal | Variable / Low | Flexible for screening, less mature for large-scale manufacturing |
1.3 Vector Design Features
- Promoter selection: strong inducible systems such as T7 or tac support high transcript output.
- Signal sequence: optional periplasmic targeting can improve folding or simplify clarification.
- Codon optimization: improves translation efficiency in the chosen bacterial host.
- Fusion tags: useful for early capture but often removed before final product release.
- Transcriptional termination: supports plasmid stability and expression consistency.
2. Fermentation Process and Upstream Optimization
Large-scale recombinant uricase production generally relies on fed-batch fermentation to achieve high biomass and strong expression while limiting overflow metabolism. Practical success depends on balancing expression intensity with product solubility and stability.
2.1 Core Process Parameters
- Temperature: growth often begins at 30–37°C, with a lower post-induction temperature used to improve soluble yield.
- pH: typically controlled near neutral range to support robust metabolism.
- Dissolved oxygen: maintained through agitation and sparging to prevent oxygen limitation.
- Induction timing: usually mid-log phase for a balance between biomass and expression quality.
- Feed strategy: glucose or glycerol is often fed in a limiting manner to suppress acetate accumulation.
| Component | Function | Typical Range | Operational Note |
|---|---|---|---|
| Carbon source | Energy and biomass generation | 10–40 g/L initial or fed input | Fed-batch control helps avoid overflow metabolism |
| Nitrogen source | Protein synthesis | 10–30 g/L or equivalent defined salts | Composition affects growth rate and impurity profile |
| Phosphates | Buffering and biosynthesis support | 50–200 mM | Helps stabilize pH during dense growth |
| Trace elements | Enzymatic cofactors | mg/L level | Needed for reproducible cell performance |
| Vitamins | Metabolic support | microgram to milligram range | Can improve consistency in defined media |
| Antifoam | Foam control | 0.01–0.1% | Critical in aerated high-density fermentation |
2.2 Harvest and Cell Disruption
After induction, biomass is usually recovered by centrifugation or tangential flow filtration and then processed by high-pressure homogenization or other disruption methods. The goal is to maximize recovery of active uricase while minimizing proteolysis, viscosity, and host-cell impurity carryover.
For recombinant uricase, upstream optimization should focus on increasing soluble active enzyme, not just total expression level. High titer alone is not sufficient if refolding burden, endotoxin load, or aggregate formation rise in parallel.
3. Purification Methods and Downstream Strategy
Downstream processing converts crude lysate into a highly purified, PEGylation-ready uricase intermediate. Because the final product is intended for parenteral use, the purification train must simultaneously control host cell proteins, nucleic acids, endotoxin, aggregates, and process-related contaminants.
3.1 Initial Recovery and Capture
Early recovery may include clarification, optional nuclease treatment, ammonium sulfate precipitation, or affinity capture if the construct includes a removable purification tag. At this stage, the process aims to rapidly reduce complexity and concentrate the target enzyme without excessive activity loss.
3.2 Chromatographic Polishing Strategy
| Step | Method | Primary Principle | Main Purpose | Illustrative Yield |
|---|---|---|---|---|
| Capture | Ion exchange chromatography | Charge separation | Bulk impurity reduction and concentration | 70–85% |
| Intermediate | Hydrophobic interaction chromatography | Surface hydrophobicity | Host protein and endotoxin reduction | 60–75% |
| Polishing | Size exclusion chromatography | Molecular size | Aggregate removal and buffer exchange | 50–65% |
| Final polish | Second ion exchange step | Charge refinement | Residual impurity clearance and final consistency | 45–60% |
3.3 Pre-PEGylation Readiness
- Adjust protein concentration into the desired reaction range
- Exchange into a PEGylation-compatible buffer lacking competing amines
- Confirm purity, activity, and endotoxin before conjugation
- Minimize aggregate burden prior to PEG reaction to reduce downstream complexity
4. PEGylation Integration
PEGylation transforms purified uricase into the longer-circulating final drug substance by increasing hydrodynamic size and modifying the enzyme surface. In pegloticase production, NHS-activated mPEG reacts with accessible primary amines, so the reaction environment must be tightly controlled to balance conversion efficiency and activity retention.
4.1 Process Variables That Matter Most
| Parameter | Typical Range | Impact on Product | Optimization Goal |
|---|---|---|---|
| PEG molecular weight | Typically 10 kDa linear PEG | Changes half-life, viscosity, and conjugate behavior | Balance pharmacokinetic benefit and manufacturability |
| PEG:protein ratio | Approximately 20:1 to 50:1 molar | Controls degree of modification | Increase conjugation without excessive over-modification |
| Reaction pH | 7.5–8.5 | Influences amine reactivity and protein stability | Preserve activity while enabling efficient coupling |
| Temperature | 4–25°C | Affects selectivity and kinetics | Choose between higher specificity and faster reaction |
| Reaction time | 1–4 hours | Determines conversion completeness and heterogeneity | Stop before degradation or excessive side products accumulate |
4.2 Post-PEGylation Purification
After conjugation, the mixture typically contains PEGylated uricase, unmodified protein, hydrolyzed PEG reagent, and positional variants. Cation exchange, size exclusion chromatography, and ultrafiltration/diafiltration are commonly combined to enrich the desired PEGylated species and place the product into its final formulation buffer.
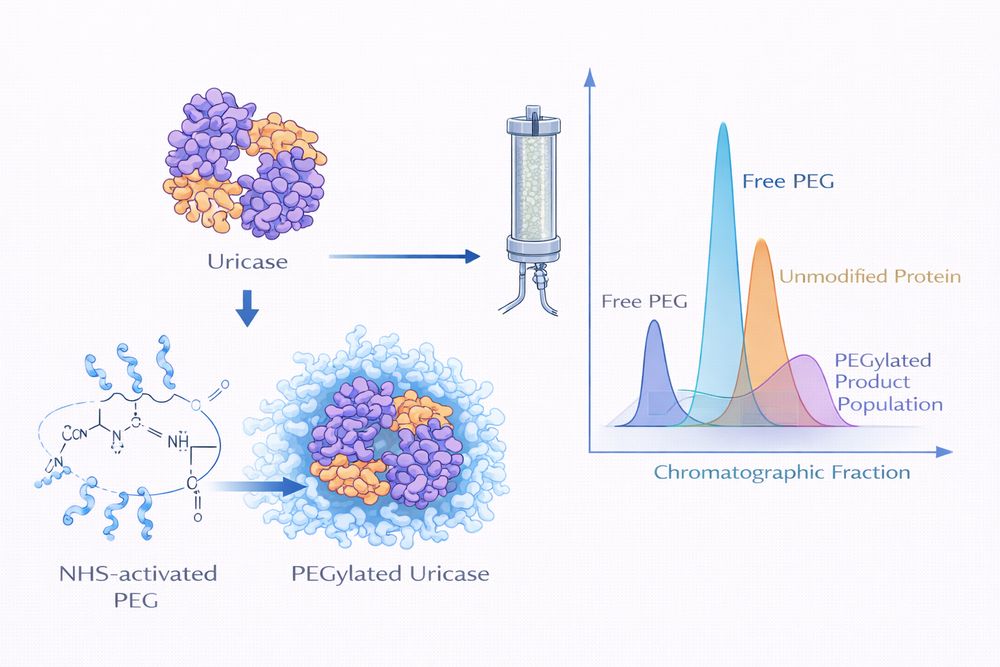
Fig 2. Recommended visual for PEGylation workflow and cleanup sequence.
5. Quality Control and Analytical Release Testing
Comprehensive quality control is essential to show that recombinant uricase manufacturing produces a consistent, potent, and safe drug substance. Release testing must confirm identity, PEGylation extent, purity, potency, sterility-related controls, and process impurity limits.
| Test | Method | Main Objective | Typical Specification Focus |
|---|---|---|---|
| Identity | Peptide mapping, mass spectrometry | Confirm correct sequence and product identity | Reference-consistent profile |
| Molecular weight | SDS-PAGE, SEC-MALS | Verify PEGylation extent | Expected high-mass conjugate distribution |
| Purity | SEC-HPLC, RP-HPLC | Measure aggregates and residual impurities | Often 95% or greater purity target |
| Potency | Enzymatic activity assay | Confirm functional uricase activity | Defined activity per mg |
| PEGylation degree | NMR, colorimetric or orthogonal methods | Assess conjugation consistency | Expected PEG loading window |
| Endotoxin | LAL assay | Parenteral safety control | Low EU per dose requirement |
| Host cell proteins / DNA | ELISA, qPCR | Process impurity control | Low residual ppm or ng per dose |
5.1 High-Value Analytical Tools
- SEC: tracks aggregate content, which is a critical quality attribute for biologics.
- RP-HPLC: helps resolve chemical heterogeneity and positional variants.
- Mass spectrometry: confirms sequence, intact mass, and modification pattern.
- Activity assay: directly links release testing to therapeutic function.
6. Yield Optimization and Scale-Up Challenges
Commercial viability depends on cumulative yield, process robustness, and manufacturability at large scale. Losses compound across expression, recovery, polishing, PEGylation, and final fill-finish, so targeted improvements at each step can materially affect overall economics.
| Stage | Illustrative Yield | Main Loss Mechanism |
|---|---|---|
| Fermentation | 3–5 g/L broth equivalent output | Expression variability and solubility limits |
| Primary recovery | 70–80% | Insoluble product and proteolysis |
| Capture chromatography | 75–85% | Target loss in flow-through and impurity separation tradeoffs |
| Intermediate purification | 70–80% | Resolution limits and buffer transitions |
| Polishing | 80–90% | Aggregate removal and cut selection |
| PEGylation plus final purification | 60–70% | Reaction inefficiency and cleanup loss |
| Final formulation | >95% | Filtration and filling losses |
6.1 Key Scale-Up Risks
- Bioreactor mixing and mass transfer: oxygen delivery and temperature uniformity become more difficult at scale.
- Chromatography scale-up: bed packing quality, pressure, and linear velocity control become more sensitive.
- PEGylation homogeneity: reagent addition and mixing must stay uniform across large reaction volumes.
- Regulatory comparability: any process change may trigger analytical or bridging requirements.
The strongest recombinant uricase process is one that preserves comparability during scale-up. High yield is valuable, but consistent product identity, low endotoxin, low aggregate burden, and stable PEGylation distribution are what ultimately determine whether the process is commercially credible.
References
- Walsh, G. Biopharmaceutical benchmarks 2018. Nature Biotechnology. 2018;36(12):1136-1145.
- Veronese, F. M., and Mero, A. The impact of PEGylation on biological therapies. BioDrugs. 2008;22(5):315-329.
- Jevsevar, S., Kunstelj, M., and Porekar, V. G. PEGylation of therapeutic proteins. Biotechnology Journal. 2010;5(1):113-128.
- Shukla, A. A., and Thömmes, J. Recent advances in large-scale production of monoclonal antibodies and related proteins. Trends in Biotechnology. 2010;28(5):253-261.
- Becker, M. A., Schumacher, H. R., Wortmann, R. L., et al. Pegloticase in patients with treatment-failure gout. New England Journal of Medicine. 2011;364(11):993-1004.