Hyperuricemia Animal Model Protocol
Comprehensive Guide for Establishing Hyperuricemia Models and Evaluating Recombinant Uricase Efficacy
Abstract
The development of reliable animal models for hyperuricemia and gout research presents unique challenges due to the evolutionary loss of functional uricase in humans and great apes. Most mammals, including common laboratory species such as mice, rats, and rabbits, retain endogenous uricase activity that efficiently converts uric acid to allantoin, preventing spontaneous hyperuricemia. This fundamental species difference necessitates specific strategies to establish relevant hyperuricemic conditions for investigating Pegloticase, Recombinant Uricase efficacy and mechanisms.
hyperuricemia mouse model, uricase animal study, pegloticase in vivo protocol, gout model research, uric acid animal model
1. Animal Model Selection
1.1 Species Considerations
Mice represent the most widely utilized species due to cost-effectiveness, extensive genetic characterization, and availability of immunological reagents. However, the presence of active endogenous uricase necessitates pharmacological inhibition or genetic manipulation to achieve sustained hyperuricemia.
| Species | Endogenous Uricase | Advantages | Limitations | Applications |
|---|---|---|---|---|
| Mouse (C57BL/6) | Active | Low cost, genetic tools available, well-characterized immune system | Requires pharmacological or genetic suppression of uricase | Mechanistic studies, drug screening, immunogenicity assessment |
| Rat (Sprague-Dawley) | Active | Larger size enables serial sampling, surgical interventions | Similar to mouse; requires uricase inhibition | Pharmacokinetic studies, toxicology assessment |
| Rabbit | Active | Larger blood volumes, vascular access | Higher cost, less genetic characterization | Large-scale sample collection, device testing |
| Uricase knockout mouse | Absent | Directly mimics human metabolism, no inhibitor needed | Limited availability, breeding challenges | Long-term hyperuricemia, tophus formation |
| Transgenic hUOX mouse | Human uricase variant | Controlled expression, inducible models | Complex genetics, variable expression | Conditional hyperuricemia, tissue-specific studies |
1.2 Strain Selection
C57BL/6 mice are preferred for most applications due to their well-defined immune responses, susceptibility to metabolic manipulations, and extensive background data. BALB/c mice may be preferred for specific immunological studies due to their Th2-biased immune responses. For studies involving tophus formation or joint pathology, DBA/1 or collagen-induced arthritis models may provide relevant inflammatory backgrounds.
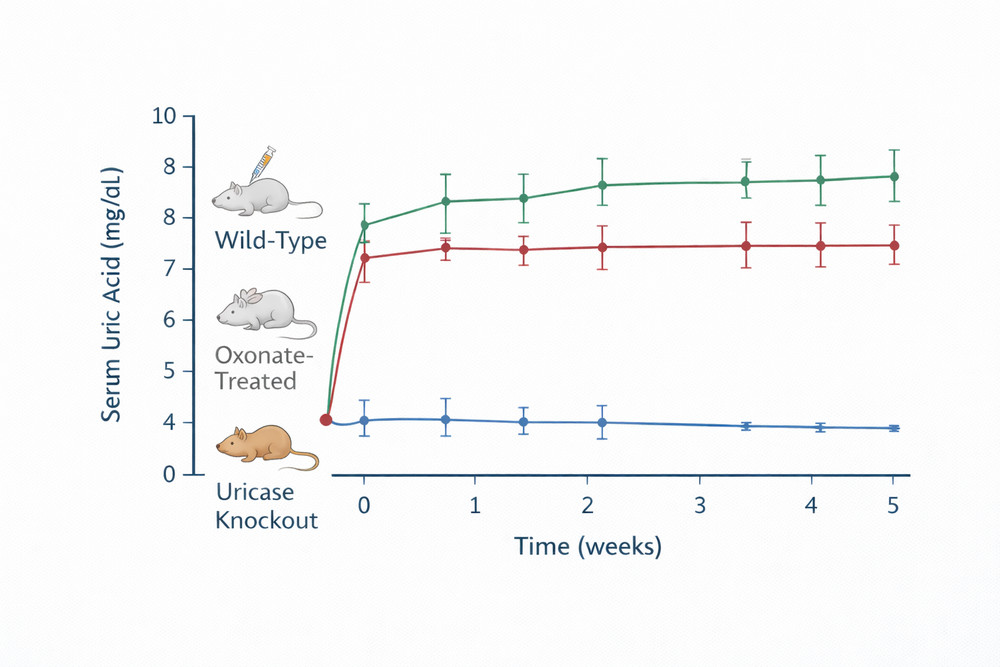
Fig 1. Comparison of serum uric acid levels in wild-type vs. oxonate-treated vs. uricase knockout mice over time
2. Induction of Hyperuricemia
Multiple approaches establish hyperuricemia in animal models, each with distinct advantages and applications.
2.1 Pharmacological Uricase Inhibition
The most common method employs potassium oxonate (oxonic acid potassium salt), a competitive inhibitor of uricase that blocks the conversion of uric acid to allantoin. This approach offers several advantages: technical simplicity, dose-dependent hyperuricemia, and reversibility allowing controlled studies.
Protocol for Oxonate-Induced Hyperuricemia:
- Preparation: Dissolve potassium oxonate in sterile saline or phosphate-buffered saline (PBS) at 50-250 mg/mL; adjust pH to 7.0-7.4 with NaOH if necessary
- Administration routes:
- Intraperitoneal (IP): 250-500 mg/kg daily; reliable absorption, technically simple
- Subcutaneous (SC): 250 mg/kg daily; slower absorption, sustained levels
- Oral gavage: 500-1000 mg/kg daily; mimics clinical administration but variable absorption
- Dosing schedule: Administer once or twice daily depending on desired duration and severity of hyperuricemia
- Dietary supplementation: Combine with high-purine diet (yeast extract, adenine, or inosine) to enhance uric acid substrate availability
| Method | Dose/Procedure | Onset | Duration | Peak Serum Urate | Considerations |
|---|---|---|---|---|---|
| Potassium oxonate (IP) | 250 mg/kg daily | 2-4 hours | 8-12 hours per dose | 15-25 mg/dL | Reversible; requires repeated dosing |
| Oxonic acid (dietary) | 2-3% w/w in chow | 3-5 days | Sustained with diet | 10-20 mg/dL | Chronic model; less labor-intensive |
| Uric acid injection | 250 mg/kg IP | 1-2 hours | 4-6 hours | Variable | Acute spikes; kidney injury risk |
| Adenine diet | 0.75-1.5% w/w | 1-2 weeks | Sustained | 8-15 mg/dL | Nephrotoxicity; models renal gout |
| Transgenic KO | Genetic deletion | Baseline | Lifelong | 10-30 mg/dL | Expensive; breeding required |
2.2 Dietary Manipulation
High-purine diets enhance hyperuricemia by increasing uric acid substrate availability. Standard approaches include:
- Yeast extract supplementation: 10-20% w/w in chow; rich in RNA/purines
- Adenine supplementation: 0.75-1.5% w/w; direct purine precursor
- Inosine administration: 0.5-1% in drinking water; purine nucleoside
These dietary approaches prove particularly effective when combined with uricase inhibition, achieving sustained hyperuricemia suitable for chronic intervention studies.
2.3 Genetic Models
Uricase knockout mice (Uox-/-) provide a genetic model of human-like hyperuricemia without pharmacological intervention. These mice develop spontaneous hyperuricemia (serum urate 10-30 mg/dL), urinary uric acid stones, and renal dysfunction resembling human gouty nephropathy. However, they do not typically develop articular tophi or inflammatory arthritis without additional manipulations, limiting their utility for joint-specific studies.
3. Treatment Design
Experimental protocols evaluating Pegloticase, Recombinant Uricase require careful design to ensure valid pharmacodynamic and pharmacokinetic assessments.
3.1 Study Groups
Standard experimental designs include:
- Sham control: Vehicle administration without oxonate or uricase
- Hyperuricemia control: Oxonate treatment only; establishes baseline pathology
- Positive control: Established urate-lowering therapy (allopurinol, febuxostat)
- Test article: Pegloticase at specified dose and schedule
- Combination therapy: Pegloticase with immunomodulatory agents (if investigating mitigation strategies)
3.2 Randomization and Blinding
Randomize animals to treatment groups using stratified randomization based on baseline body weight and serum uric acid levels. Implement blinding where possible, with coded syringes and independent assessors for endpoint measurements.
3.3 Sample Size Calculation
Power analysis based on expected effect size (typically 50-70% reduction in serum uric acid), observed variability (CV 20-30%), and desired power (80-90%) typically requires 8-12 animals per group for primary endpoint assessment.
4. Dosing Strategies
Optimization of pegloticase dosing in animal models requires consideration of species-specific pharmacokinetics, immunogenicity, and translational relevance.
| Species | Dose Range | Route | Frequency | Rationale |
|---|---|---|---|---|
| Mouse | 0.5-5 mg/kg | IV (tail vein), IP | Single or every 3-7 days | Scaled from human 8 mg biweekly; adjust for metabolic rate |
| Rat | 0.2-2 mg/kg | IV (tail or jugular), SC | Single or weekly | Larger blood volumes enable PK profiling |
| Rabbit | 0.1-1 mg/kg | IV (marginal ear vein) | Single or biweekly | Scaled human equivalent dose |
4.1 Pharmacokinetic Considerations
Rodents clear PEGylated proteins more rapidly than humans due to higher metabolic rates and differences in reticuloendothelial system function. Expect shorter half-lives (2-5 days vs. 10-14 days in humans) and adjust dosing frequency accordingly. For sustained urate lowering, more frequent administration (every 3-7 days) may be necessary compared to clinical biweekly regimens.
4.2 Route of Administration
- Intravenous (IV): Ensures complete bioavailability; preferred for PK/PD studies
- Intraperitoneal (IP): Technically simpler; partial absorption via portal circulation; suitable for efficacy screening
- Subcutaneous (SC): Slower absorption; may mimic clinical depot formulations; assess local tolerability
4.3 Immunogenicity Assessment
Include sampling schedules to evaluate anti-pegloticase antibody formation:
- Baseline (pre-dose)
- Day 7, 14, 28 post-dose
- Endpoint (study termination)
Collect serum for ADA analysis using bridging ELISAs or cell-based neutralization assays.
5. Biomarker Analysis
Comprehensive biomarker assessment enables mechanistic understanding of pegloticase effects and validation of therapeutic efficacy.
| Biomarker | Measurement Method | Timepoints | Interpretation |
|---|---|---|---|
| Serum uric acid | Uricase/PAP method or HPLC | Baseline, 2, 6, 24, 48, 72 hours post-dose; then weekly | Primary efficacy endpoint; target <6 mg/dL |
| Serum allantoin | HPLC-UV or LC-MS/MS | Baseline, 2, 6, 24 hours | Pharmacodynamic confirmation of uricase activity |
| Blood urea nitrogen (BUN) | Clinical chemistry analyzer | Baseline, weekly | Renal function monitoring |
| Creatinine | Clinical chemistry analyzer | Baseline, weekly | Renal function assessment |
| Cytokines (IL-1β, IL-6, TNF-α) | Multiplex ELISA or Luminex | Baseline, 2, 6, 24 hours | Inflammatory response to urate lowering |
| Anti-pegloticase antibodies | ELISA or cell-based assay | Baseline, days 7, 14, 28, endpoint | Immunogenicity assessment |
5.1 Urine Biomarkers
Collect 24-hour urine specimens for:
- Urinary uric acid excretion (assess renal handling)
- Urinary allantoin (confirm systemic uricase activity)
- Urine volume and creatinine (normalize excretion rates)
- Microalbumin (early renal injury marker)
5.2 Tissue Biomarkers
For mechanistic studies, consider tissue-specific analyses:
- Kidney: Uric acid crystal deposition (polarized light microscopy), inflammatory infiltrates (histology), oxidative stress markers (8-OHdG, malondialdehyde)
- Liver: Uricase activity (if assessing residual endogenous activity), drug accumulation (if relevant)
- Joint (if applicable): Synovial fluid uric acid, cytokine profiles, inflammatory cell counts
6. Histological Evaluation
Tissue pathology assessment provides critical endpoints for evaluating hyperuricemia-induced organ damage and therapeutic protection.
6.1 Kidney Histology
The kidney represents the primary target organ for hyperuricemia-induced pathology in rodent models. Standard evaluation includes:
- Crystal deposition: Deparaffinized sections examined under polarized light microscopy for birefringent uric acid crystals; grade severity (0-4 scale) based on distribution and density
- Tubular injury: Hematoxylin and eosin (H&E) staining for tubular dilation, epithelial necrosis, cast formation
- Interstitial inflammation: Immunohistochemistry for macrophage (F4/80) and T-cell (CD3) markers
- Fibrosis: Masson's trichrome or Sirius red staining for collagen deposition; morphometric quantification
- Oxidative stress: 4-hydroxynonenal (4-HNE) or nitrotyrosine immunostaining
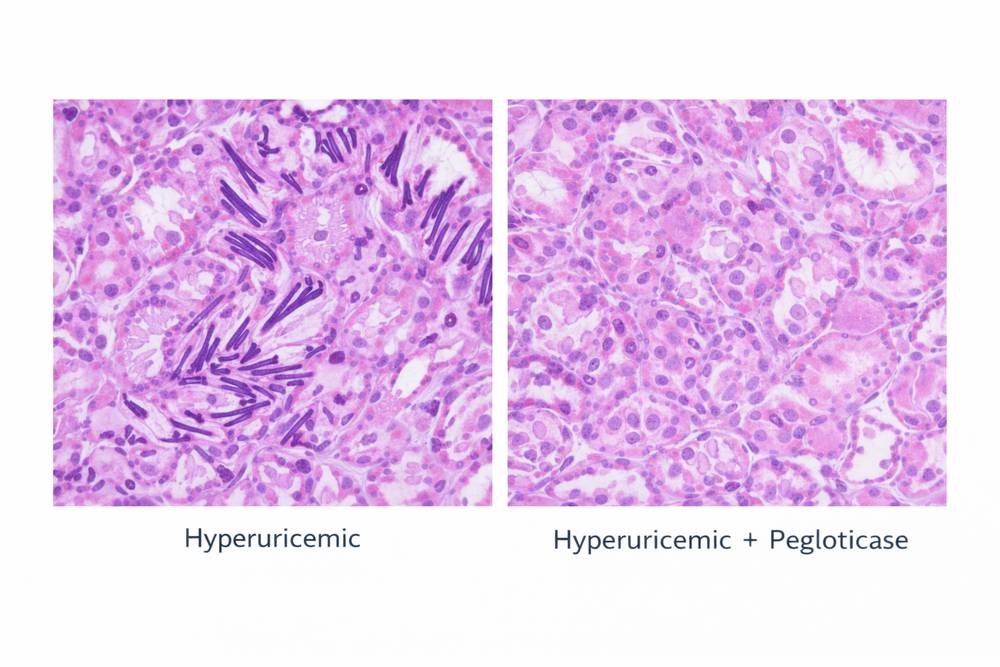
Fig 2. Representative kidney histology images showing uric acid crystal deposition in hyperuricemic mice and reduction with pegloticase treatment
6.2 Joint Histology (if inflammatory model)
For models incorporating joint inflammation:
- Synovitis scoring: H&E evaluation of synovial hyperplasia, inflammatory infiltrate, pannus formation
- Cartilage integrity: Toluidine blue or Safranin O staining for proteoglycan content
- Bone erosion: Tartrate-resistant acid phosphatase (TRAP) staining for osteoclast activity
6.3 Systemic Tophus Assessment
In chronic models, assess for soft tissue tophus formation:
- Subcutaneous deposits: Visual inspection and palpation; excision for histological confirmation
- Visceral deposits: Systematic examination of heart valves, tendons, and other predilection sites at necropsy
7. Data Interpretation
Rigorous data analysis transforms raw measurements into meaningful conclusions about pegloticase efficacy and mechanisms.
7.1 Primary Efficacy Analysis
Calculate percentage change in serum uric acid from baseline to specified timepoints. Use area under the curve (AUC) analysis for time-course data to capture sustained efficacy. Compare treatment groups using ANOVA with post-hoc testing or non-parametric alternatives if distributional assumptions are violated.
7.2 Responder Analysis
Define responders as animals achieving serum uric acid <6 mg/dL (or specified threshold) at ≥80% of post-baseline measurements, mirroring clinical trial definitions. Calculate response rates and compare between groups using Fisher's exact test or chi-square analysis.
7.3 Pharmacokinetic-Pharmacodynamic Integration
Model the relationship between pegloticase concentration (from PK substudies) and uric acid response using inhibitory Emax models:
Effect = Ebaseline − (Emax × Cγ) / (EC50γ + Cγ)
where C is pegloticase concentration, EC50 is the concentration producing half-maximal effect, and γ is the Hill coefficient describing slope steepness.
7.4 Correlation Analyses
Explore relationships between:
- Anti-pegloticase antibody titers and serum uric acid rebound
- Urinary allantoin excretion and systemic urate lowering
- Renal histopathology scores and functional biomarkers (BUN, creatinine)
8. Study Validity Considerations
Ensure experimental rigor through attention to confounding factors:
8.1 Oxonic Acid Interactions
Potassium oxonate may have off-target effects including inhibition of other enzymes and potential nephrotoxicity at high doses. Include appropriate controls (oxonate-only groups) and monitor for non-specific toxicity.
8.2 Immunogenicity Limitations
Rodents develop robust immune responses to human proteins that may not fully replicate human immunogenicity patterns. Consider using immunodeficient strains (SCID, nude) or immunosuppressive regimens if studying chronic dosing without confounding ADA effects.
8.3 Translational Relevance
Recognize that rodent models, while valuable, do not perfectly replicate human gout pathophysiology. Mice lack the inflammatory response to MSU crystals seen in humans, and species differences in purine metabolism limit direct extrapolation. Validate key findings in complementary models or human tissues when possible.
For investigators establishing hyperuricemia models or evaluating uricase-based therapies, Pegloticase, Recombinant Uricase provides a well-characterized, clinically relevant test article with established pharmacological properties and manufacturing consistency suitable for rigorous preclinical research.
References
1. Sánchez-Lozada LG, et al. (2012). "Uric acid-induced renal vasoconstriction is mediated by activation of the renin-angiotensin system and oxidative stress." Am J Physiol Renal Physiol, 302(8): F963-F970.
2. Benn CL, et al. (2016). "Physiology of hyperuricemia and urate-lowering treatments." Front Med, 3: 53.
3. Hershfield MS, et al. (2006). "Pegloticase (PEG-uricase) for treatment of hyperuricemia in patients with treatment-failure gout." Arthritis Rheum, 54(Suppl): S227.
4. Wu X, et al. (1994). "Two independent mutational events in the loss of urate oxidase during hominoid evolution." J Mol Evol, 34(1): 78-84.
5. Matsuura W, et al. (2012). "Establishment of a novel hyperuricemia model using uricase-deficient rats." J Pharmacol Sci, 119(3): 275-281.
6. Cammalleri L, et al. (2017). "Animal models of hyperuricemia." Inflammation, 40(6): 1934-1947.
7. Feig DI, et al. (2008). "The role of uric acid in kidney disease." J Am Soc Nephrol, 19(12): 2305-2308.
8. Sundy JS, et al. (2011). "Efficacy and tolerability of pegloticase for the treatment of chronic gout in patients refractory to conventional treatment." JAMA, 306(7): 711-720.