PK Study Design for Pegloticase and PEGylated Enzymes
A practical framework for pharmacokinetic and pharmacodynamic study design in biologic uricase development
PK Fundamentals for Biologics
Pharmacokinetic characterization of biologic drugs differs substantially from that of small molecules. Large molecular size, structural complexity, and immunologic behavior influence absorption, distribution, metabolism, and clearance in ways that require tailored study design. For PEGylated enzymes such as Pegloticase, PEG conjugation further modifies circulation time, tissue penetration, renal handling, and immunogenicity.
The foundational PK parameters remain familiar—Cmax, Tmax, AUC, t1/2, CL, and Vd—but their interpretation must account for the macromolecular behavior of the therapeutic enzyme. A larger hydrodynamic radius typically reduces renal filtration, while the PEG hydration shell can restrict extravascular distribution and alter cellular uptake.
pegloticase pharmacokinetics, PK PD uricase, biologics PK study design, PEGylated enzyme PK, sampling strategies, bioanalytical methods, PK/PD modeling
| Parameter | Native Proteins | PEGylated Proteins | Study Design Implication |
|---|---|---|---|
| Molecular weight | Typically 10–150 kDa | Often 136–540 kDa or higher | Reduced filtration and prolonged systemic persistence |
| Renal clearance | Often substantial | Usually limited | Longer sampling windows are needed |
| Distribution | Broader extravascular penetration | More restricted to vascular space | Lower apparent tissue exposure may be observed |
| Proteolytic degradation | More prominent | Reduced by PEG shielding | Enhanced stability can increase exposure |
| Immunogenic clearance | Variable | Partially reduced, but still clinically relevant | ADA monitoring should be built into PK studies |
| Half-life | Hours | Days to weeks | Sparse late-phase sampling becomes essential |
1. Sampling Strategies
Well-designed sampling schedules should define the full concentration-time profile while controlling operational burden. For PEGylated enzymes, early distribution-phase samples and extended terminal-phase collections are both important, especially when half-life may exceed one week.
1.1 Single Ascending Dose Studies
For first-in-human or exploratory dose-ranging studies, the schedule should capture baseline status, infusion completion, distribution, early elimination, and late terminal elimination. Pre-dose samples are also useful for screening pre-existing antibodies or endogenous interferences.
| Timepoint | Purpose | Collection Notes |
|---|---|---|
| Pre-dose | Baseline PK/ADA screening | Within 1 hour before infusion |
| End of infusion | Cmax estimation | Collect immediately when infusion ends |
| 15 min, 30 min, 1 hr | Distribution phase | Important for early profile definition |
| 2, 4, 8, 12 hr | Early elimination | Supports non-compartmental analysis |
| 24, 48, 72 hr | Terminal phase onset | Daily sampling during the first week |
| Days 4–7 | Half-life estimation | Continue until concentrations approach LLOQ |
| Days 10, 14, 21, 28 | Extended terminal phase | Critical for long-circulating PEGylated enzymes |
| Day 56 or Day 84 follow-up | Late elimination and ADA review | Useful when half-life exceeds 14 days |
1.2 Multiple-Dose Studies
In repeated-dose studies, PK design must address accumulation, time to steady state, dose proportionality, and immunogenicity-driven changes in exposure. A combination of full profiles and sparse intermediate sampling is usually sufficient.
| Visit | Sampling Window | Main Goal |
|---|---|---|
| Day 1 (Dose 1) | Full single-dose profile | Baseline PK characterization |
| Day 8 | Pre-dose trough | Evaluate accumulation |
| Day 15 | Pre-dose, 1 hr, 24 hr, 72 hr | Assess inter-dose consistency |
| Day 29 | Full profile | Approximate steady-state characterization |
| Day 57 | Sparse profile | Long-term stability and exposure review |
| Follow-up | Weekly until LLOQ; monthly ADA checks | Terminal elimination and immunogenicity tracking |
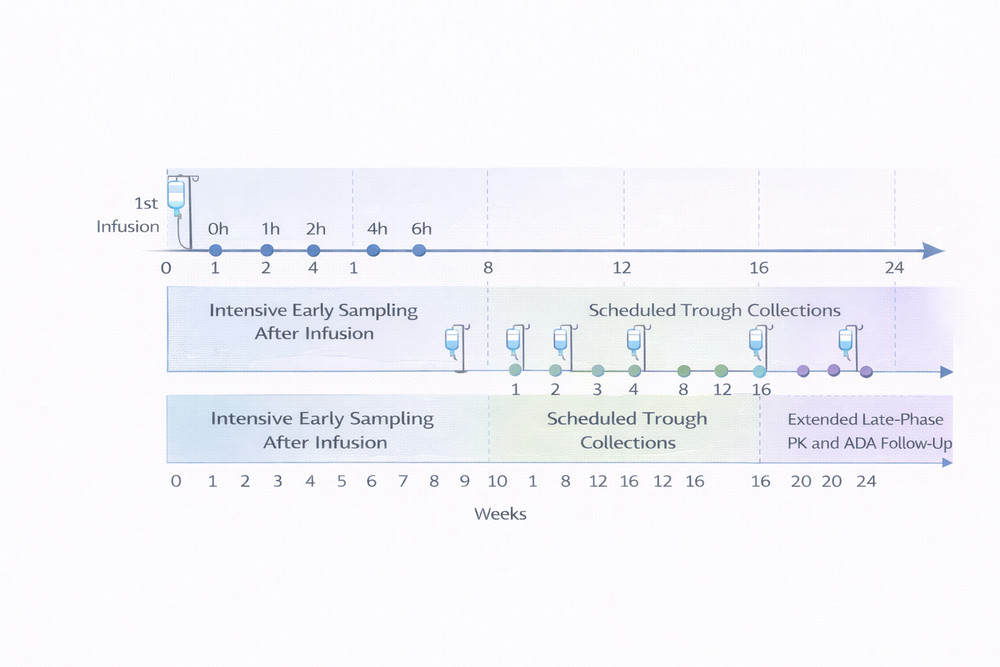
Fig 1. Recommended PK sampling framework for single- and multiple-dose biologic studies.
2. Key PK Parameters and Modeling Approaches
2.1 Non-compartmental Analysis
Non-compartmental analysis remains the standard first-pass approach for biologic PK evaluation. Cmax and Tmax are obtained directly from observed data, while AUC, terminal elimination rate constant, half-life, clearance, and terminal volume of distribution are derived using established methods. For PEGylated enzymes, reliable estimation depends on collecting sufficiently late samples to define the terminal log-linear phase.
2.2 Compartmental and Population PK Modeling
For pegloticase-like molecules, two-compartment models often fit concentration-time data better than one-compartment structures because they capture a rapid distribution component followed by a slower elimination phase. Population PK modeling is particularly valuable when evaluating between-subject variability and important covariates such as body weight, anti-drug antibody status, renal function, and hepatic function.
- Body weight: often influences apparent volume of distribution.
- ADA status: may substantially increase clearance and reduce exposure.
- Renal function: usually has less impact than with small molecules, but should still be assessed.
- Hepatic function: may affect metabolism and catabolic pathways.
3. Bioanalytical Methods
Quantifying pegloticase requires assays that are fit for purpose, robust against matrix effects, and capable of distinguishing active enzyme from inactive or degraded material. In practice, bioanalytical strategy often combines orthogonal methods rather than relying on a single assay format.
3.1 Enzymatic Activity Assays
Activity-based assays are pharmacologically intuitive because they quantify catalytically active uricase. Spectrophotometric monitoring of uric acid consumption is commonly used and can provide a direct bridge between PK and PD. However, these assays may not distinguish intact drug from active fragments and can be affected by endogenous matrix components.
3.2 Immunoassays and LC-MS/MS
ELISA-based methods are useful for routine total-drug screening, while LC-MS/MS provides higher structural specificity and is valuable for confirmatory work, peptide-level quantification, or metabolite studies. Anti-drug antibodies can distort immunoassay measurements, so assay validation must explicitly examine interference risk.
| Method | Target | Strength | Limitation | Typical Use |
|---|---|---|---|---|
| Enzymatic assay | Functional activity | Direct PD relevance | Limited structural specificity | PK/PD bridging and potency assessment |
| ELISA (anti-uricase) | Total protein | High throughput | ADA interference possible | Routine PK screening |
| ELISA (anti-PEG) | PEG moiety | Sensitive PEG-focused detection | May miss de-PEGylated variants | PEG-specific support assays |
| LC-MS/MS | Protein, peptides, metabolites | High specificity | Higher complexity and cost | Confirmatory and mechanistic studies |
| Surface plasmon resonance | Binding kinetics | Mechanistic resolution | Low throughput | Advanced characterization |
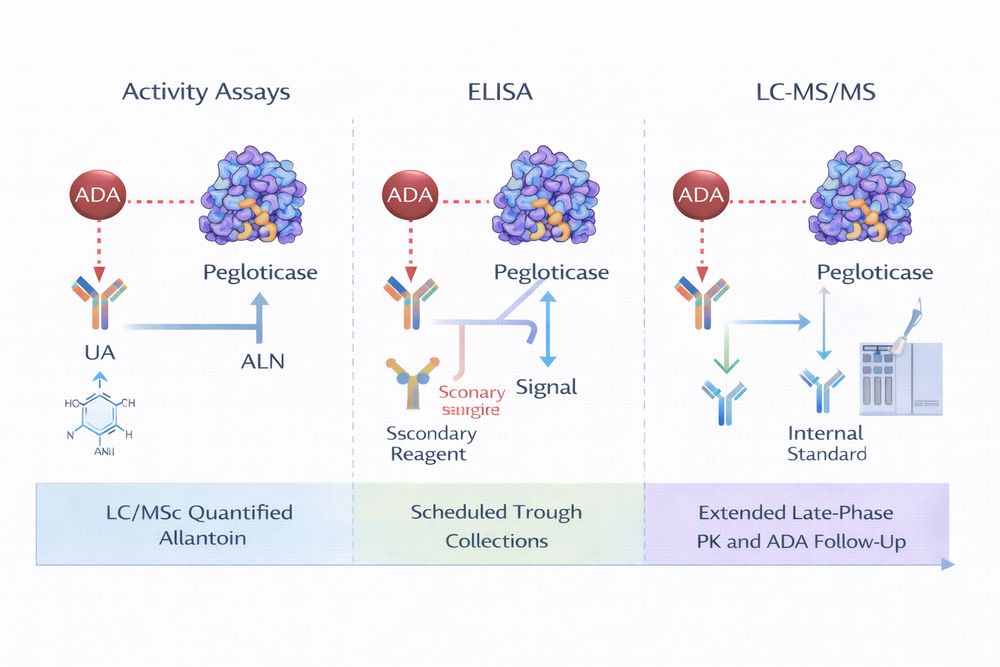
Fig 2. Orthogonal assay strategy for PEGylated uricase characterization.
4. PK/PD Modeling
Integration of PK and PD data enables a mechanistic understanding of how pegloticase exposure drives serum uric acid reduction. Direct response models can link concentration to urate lowering in a relatively simple manner, while indirect response models better represent time-dependent urate production and elimination. For longer studies, time-varying models that incorporate ADA development are especially informative.
- Direct response models: suitable for relating plasma concentration to immediate urate-lowering effect.
- Indirect response models: better for dynamic uric acid turnover and delayed system response.
- Time-varying clearance models: useful when immunogenicity progressively changes drug exposure.
In pegloticase development, ADA-linked loss of exposure is often the dominant factor shaping longitudinal PK/PD behavior, so models that ignore time-varying clearance may underperform.
5. Case Study and Data Interpretation
5.1 Representative Study Design
A representative refractory gout PK study may use an open-label, dose-escalation design with multiple IV cohorts dosed every two weeks. Endpoints typically include Cmax, AUC, half-life, clearance, volume of distribution, urate response, and ADA status over time.
5.2 Interpreting the Data
Several issues are especially important when reviewing PEGylated uricase PK data:
- Immunogenicity impact: ADA development can increase clearance several-fold and rapidly shorten exposure.
- Activity versus concentration: total drug and active drug may diverge when inactive but still immunoreactive material is present.
- Target-mediated behavior: low-concentration nonlinearity may occur and should be evaluated during model building.
- Clinical translation: trough concentrations can help guide dosing frequency and anticipate loss of response.
For translational researchers, Pegloticase, Recombinant Uricase serves as a well-characterized reference compound for study planning, assay selection, and PK/PD interpretation in the broader PEGylated enzyme field.
References
- Mager, D. E., and Jusko, W. J. General pharmacokinetic model for drugs exhibiting target-mediated drug disposition. Journal of Pharmacokinetics and Pharmacodynamics. 2001;28(6):507-532.
- Veronese, F. M., and Mero, A. The impact of PEGylation on biological therapies. BioDrugs. 2008;22(5):315-329.
- Becker, M. A., Schumacher, H. R., Wortmann, R. L., et al. Pegloticase in patients with treatment-failure gout. New England Journal of Medicine. 2011;364(11):993-1004.
- Sundy, J. S., Baraf, H. S. B., Yood, R. A., et al. Efficacy and tolerability of pegloticase for the treatment of chronic gout in patients refractory to conventional treatment. JAMA. 2011;306(7):711-720.
- Shah, D. K., and Betts, A. M. Antibody biodistribution coefficients: Inferring tissue concentrations from plasma pharmacokinetics in preclinical species and humans. mAbs. 2013;5(2):297-305.