In Vitro Hyaluronan Degradation Study Using Recombinant Human Hyaluronidase
A Comprehensive Protocol for HA Degradation Assay, Enzyme Kinetics, and ECM Modeling
Abstract
Hyaluronan (HA), a high-molecular-weight glycosaminoglycan abundant in the extracellular matrix (ECM), plays a central role in tissue hydration, cell migration, and inflammation. Recombinant human hyaluronidase (rHuPH20) enables controlled, reproducible HA degradation under defined in vitro conditions, making it an indispensable tool for ECM modeling, drug permeability studies, and enzyme kinetic research. This protocol provides a step-by-step guide for setting up a standardized hyaluronan degradation assay using recombinant human hyaluronidase, covering substrate selection, reaction optimization, multi-modal analytical readouts, and rigorous controls. By following this workflow, researchers can generate quantitative, reproducible data on HA fragmentation patterns, degradation rates, and endpoint comparisons suitable for publication and downstream applications.
hyaluronan degradation assay, recombinant human hyaluronidase, HA degradation in vitro, ECM modeling, enzyme kinetics, glycosaminoglycan
1. Study Objective and Experimental Design
The primary objective of this protocol is to establish a robust, reproducible in vitro system for evaluating hyaluronidase-mediated hyaluronan degradation. The experimental design accommodates three common research goals:
- ECM remodeling studies: Simulate physiological or pathological HA turnover in a 3D matrix environment.
- Enzyme kinetic characterization: Determine kinetic parameters (K_m, V_max, k_cat) under standardized conditions.
- Drug permeability assessment: Quantify HA barrier disruption to evaluate small-molecule or biologic diffusion.
Each objective shares a common core workflow but may require adjustments in substrate concentration, reaction time, or analytical readout. This protocol presents the universal framework first, followed by scenario-specific recommendations.
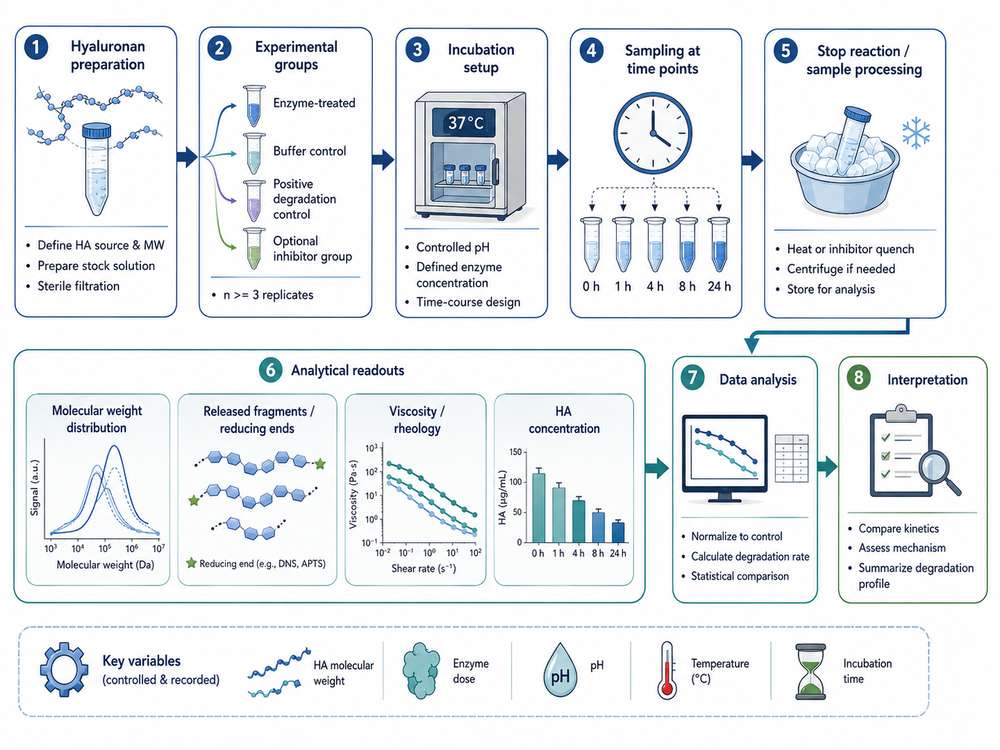
Fig 1. Experimental design workflow for in vitro hyaluronan degradation study
2. Hyaluronan Substrate Selection
Successful HA degradation assays begin with careful substrate selection. Three parameters govern substrate suitability: molecular weight, concentration, and purity.
2.1 Molecular Weight Considerations
HA molecular weight (MW) dramatically influences degradation kinetics and fragment patterns. High-MW HA (>1,000 kDa) mimics native ECM and is ideal for barrier-disruption studies, whereas low-MW HA (50-200 kDa) is preferable for rapid kinetic assays.
| HA Molecular Weight | Typical Source | Recommended Application | Expected Fragment Size |
|---|---|---|---|
| Ultra-high (>1,000 kDa) | Rooster comb, bacterial fermentation | ECM modeling, permeability assays | 100-500 kDa (intermediate), <50 kDa (endpoint) |
| High (500-1,000 kDa) | Streptococcal fermentation | General degradation kinetics | 50-200 kDa |
| Low (50-200 kDa) | Enzymatic digestion of high-MW HA | Rapid endpoint assays, LC-MS analysis | <20 kDa (tetrasaccharides and smaller) |
| Oligomeric (<20 kDa) | Chemical or enzymatic hydrolysis | Binding studies, receptor interaction | N/A (already degraded) |
2.2 Concentration and Purity
Working concentrations typically range from 0.1 to 5.0 mg/mL, depending on the analytical method. For gel electrophoresis and SEC, 1.0-2.0 mg/mL provides optimal signal-to-noise. For colorimetric assays, 0.2-0.5 mg/mL is sufficient. Purity should be >95% by carbazole assay, with endotoxin levels <0.1 EU/mg to avoid confounding cellular readouts.
3. Recombinant Human Hyaluronidase Dilution and Handling
Recombinant human hyaluronidase (rHuPH20) is supplied as a lyophilized powder or liquid formulation. Proper handling is critical to preserve enzymatic activity.
3.1 Reconstitution and Storage
Reconstitute lyophilized enzyme in sterile PBS (pH 7.4) containing 0.1% BSA as a carrier protein. Avoid repeated freeze-thaw cycles; instead, prepare single-use aliquots and store at -80°C. The recommended stock concentration is 1,000 U/mL, with working dilutions prepared fresh in reaction buffer (50 mM sodium acetate, 150 mM NaCl, pH 5.0) immediately before use.
3.2 Activity Validation
Prior to each experiment, validate enzyme specific activity using a standard turbidimetric assay with HA substrate. One unit (U) is defined as the amount of enzyme that reduces turbidity by 50% in a standard assay condition. Typical specific activity for research-grade recombinant human hyaluronidase ranges from 1.0 x 10^5 to 5.0 x 10^5 U/mg protein.
rHuPH20 is sensitive to pH extremes (<4.0 or >8.0) and temperatures above 40°C. Always pre-warm reaction buffer to 37°C before adding enzyme, and never vortex enzyme solutions; gentle pipette mixing is sufficient to avoid mechanical denaturation.
4. Reaction Conditions
Optimal hyaluronidase activity depends on precise control of pH, temperature, and reaction duration.
4.1 pH Optimization
Human hyaluronidase PH20 exhibits a sharp pH optimum at 4.5-5.5, with activity dropping by >50% at pH 6.5 and becoming essentially inactive above pH 7.5. Use a 50 mM sodium acetate buffer (pH 5.0) for standard assays. For studies requiring physiological pH, consider using a two-step protocol: initial degradation at pH 5.0 followed by neutralization to pH 7.4 for cellular readouts.
4.2 Temperature and Time Gradient
The standard reaction temperature is 37°C. For kinetic studies, collect samples at 0, 15, 30, 60, 120, and 240 minutes. For endpoint comparisons, a 2-hour incubation typically achieves complete degradation of 1 mg/mL high-MW HA with 10 U/mL enzyme. The following table summarizes recommended conditions:
| Parameter | Standard Condition | Alternative Conditions | Rationale |
|---|---|---|---|
| pH | 5.0 (sodium acetate) | 4.5, 6.0 | Optimal enzyme activity; pH 4.5 for faster kinetics, pH 6.0 for milder degradation |
| Temperature | 37°C | 25°C, 42°C | 37°C mimics physiological temperature; 25°C for slow kinetics, 42°C for accelerated screening |
| Enzyme concentration | 10 U/mL | 1-100 U/mL | 10 U/mL achieves complete degradation in 2 h; lower for partial digestion, higher for rapid screening |
| Reaction time | 2 hours | 15 min - 24 h | Time-course for kinetics; 24 h for exhaustive degradation of ultra-high-MW HA |
| Ionic strength | 150 mM NaCl | 50-300 mM NaCl | 150 mM mimics physiological ionic strength; lower salt may increase enzyme-substrate interaction |
5. Sampling Strategy: Time-Course Design
A well-designed time-course is essential for capturing degradation dynamics and avoiding endpoint bias. For kinetic characterization, use a minimum of six time points spanning the linear phase of the reaction. The recommended sampling schedule is:
- T0 (0 min): Baseline measurement before enzyme addition.
- T1 (15 min): Early-phase detection of initial cleavage events.
- T2 (30 min): Transition from high-MW to intermediate fragments.
- T3 (60 min): Mid-point of degradation for rate calculation.
- T4 (120 min): Near-complete degradation under standard conditions.
- T5 (240 min): Endpoint confirmation and exhaustive digestion assessment.
At each time point, withdraw 50-100 μL aliquots and immediately quench the reaction by adding an equal volume of ice-cold 100 mM sodium phosphate (pH 7.0) or by heating to 95°C for 5 minutes. Store quenched samples at -20°C until analysis.
6. Analytical Readouts
This protocol supports four complementary analytical methods, each providing distinct information about the degradation process.
6.1 Gel Electrophoresis (Agarose or Polyacrylamide)
Agarose gel electrophoresis (0.5-1.0% agarose in TAE buffer) resolves high-MW HA (>500 kDa) and intermediate fragments (50-500 kDa). Stain with Stains-All or toluidine blue for visualization. Polyacrylamide gel electrophoresis (4-20% gradient) is superior for low-MW fragments (<50 kDa). This method provides qualitative fragment pattern information but is not strictly quantitative.
6.2 Size Exclusion Chromatography (SEC)
SEC with multi-angle light scattering (MALS) or refractive index (RI) detection is the gold standard for quantitative MW distribution analysis. Use a Shodex OHpak SB-806M HQ column or equivalent with 0.1 M NaNO3 mobile phase at 0.5 mL/min. SEC-MALS yields absolute MW values without column calibration, enabling precise tracking of MW reduction over time.
6.3 Colorimetric Readout (Carbazole or Morgan-Elson)
The carbazole assay quantifies total uronic acid content and is useful for measuring total HA concentration. The Morgan-Elson assay specifically detects N-acetylglucosamine reducing ends generated by enzymatic cleavage, providing a direct measure of hyaluronidase activity. Both assays require a standard curve of glucuronic acid or N-acetylglucosamine, respectively.
6.4 Liquid Chromatography-Mass Spectrometry (LC-MS)
LC-MS enables identification and quantification of specific HA oligosaccharide fragments (tetrasaccharides, hexasaccharides, octasaccharides). Use a porous graphitic carbon (PGC) column with a gradient of acetonitrile in ammonium acetate. This method is essential for mapping exact cleavage sites and confirming the endo-beta-N-acetylhexosaminidase mechanism of rHuPH20.
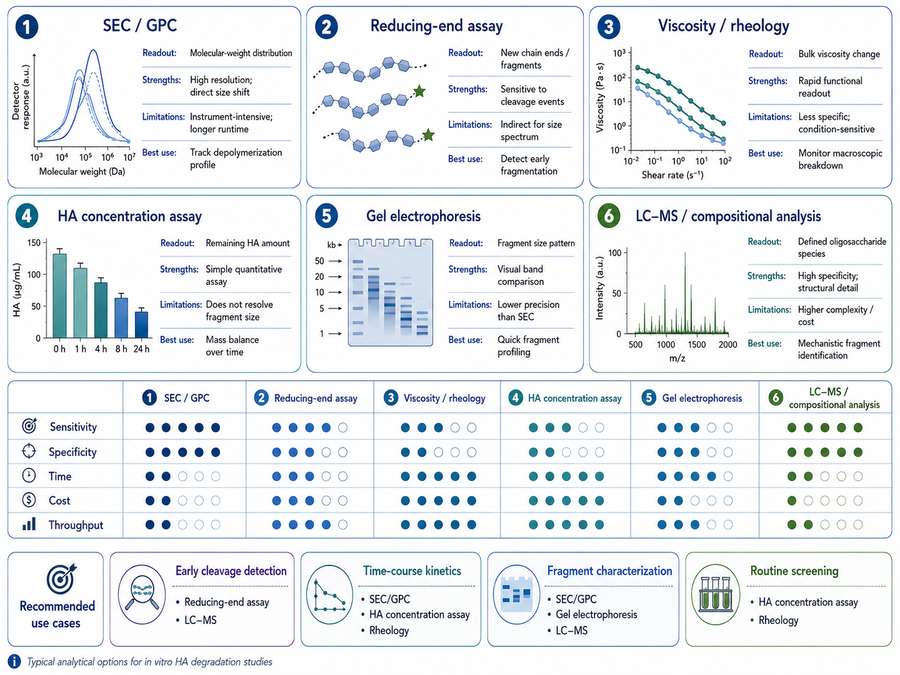
Fig 2. Comparison of analytical readouts for hyaluronan degradation monitoring
| Method | MW Range | Quantitative | Throughput | Key Information |
|---|---|---|---|---|
| Gel electrophoresis | 5-2,000 kDa | Semi-quantitative | Low (4-8 samples/gel) | Fragment pattern visualization |
| SEC-MALS | 1-5,000 kDa | Fully quantitative | Medium (12-24 samples/day) | Absolute MW distribution, polydispersity index |
| Carbazole assay | N/A (total HA) | Fully quantitative | High (96-well plate) | Total uronic acid concentration |
| Morgan-Elson assay | N/A (reducing ends) | Fully quantitative | High (96-well plate) | Enzymatic cleavage activity (reducing ends) |
| LC-MS | 0.4-20 kDa | Fully quantitative | Low (4-8 samples/day) | Oligosaccharide identity and sequence |
7. Controls
Rigorous controls are non-negotiable for distinguishing enzyme-specific degradation from non-specific hydrolysis or spontaneous HA breakdown.
7.1 Heat-Inactivated Enzyme Control
Incubate recombinant human hyaluronidase at 95°C for 10 minutes to irreversibly denature the protein. Use this heat-inactivated enzyme at the same concentration as the active enzyme in parallel reactions. Any degradation observed in this control indicates non-enzymatic HA breakdown or contaminating activity.
7.2 No-Enzyme Control
Incubate HA substrate in reaction buffer without added enzyme under identical time and temperature conditions. This control accounts for spontaneous acid hydrolysis at pH 5.0 and 37°C. Typically, no-enzyme controls show <2% degradation over 4 hours.
7.3 Positive Control
Use a commercially available bovine testicular hyaluronidase (BTH) with known specific activity as a positive control. Alternatively, prepare a fully degraded HA sample by extended incubation (24 h, 100 U/mL) and use it as a reference standard for fragment pattern comparison.
Always run all three controls in parallel with experimental samples. A valid assay requires: (1) no degradation in heat-inactivated and no-enzyme controls, and (2) complete degradation in the positive control within the expected timeframe.
8. Data Interpretation
Interpreting HA degradation data requires integration of fragment pattern, degradation rate, and endpoint comparison across all analytical methods.
8.1 Fragment Pattern Analysis
On agarose gels, intact high-MW HA appears as a tight band at the gel origin. Progressive degradation produces a smear migrating toward lower MW positions, eventually resolving into discrete low-MW bands. A "ladder" pattern with regular spacing suggests endolytic cleavage by hyaluronidase, whereas a continuous smear indicates exolytic or non-specific degradation. SEC chromatograms should show a progressive shift of the main peak toward lower elution volumes (higher MW) with increasing reaction time.
8.2 Degradation Rate Calculation
For kinetic analysis, plot the natural logarithm of remaining HA concentration (or average MW) versus time. The slope of the linear portion yields the apparent first-order rate constant (k_obs). For Michaelis-Menten kinetics, perform assays at varying substrate concentrations (0.1-5.0 mg/mL) and fit initial velocity data to the Michaelis-Menten equation using nonlinear regression. Typical K_m values for rHuPH20 on high-MW HA range from 0.3 to 1.2 mg/mL, with k_cat values of 1,000-5,000 s^-1.
8.3 Endpoint Comparison
Compare endpoint samples (T5, 240 min) across all conditions. A successful degradation reaction should reduce average MW by >90% and increase reducing-end concentration by >10-fold relative to T0. If endpoint MW remains >100 kDa, consider increasing enzyme concentration, extending reaction time, or switching to a lower-MW substrate.
9. Common Pitfalls and Optimization Tips
Even experienced researchers encounter challenges with HA degradation assays. The following table summarizes common issues and validated solutions:
| Problem | Possible Cause | Solution |
|---|---|---|
| No degradation observed | Enzyme inactivated by improper storage; pH too high; substrate too concentrated | Verify enzyme activity with positive control; check buffer pH with calibrated meter; dilute substrate to 0.5-1.0 mg/mL |
| High background in no-enzyme control | Spontaneous acid hydrolysis; contaminated substrate; prolonged incubation | Reduce reaction time; use freshly prepared substrate; add 0.02% sodium azide to prevent microbial growth |
| Inconsistent replicate data | Incomplete mixing; temperature fluctuations; pipetting error | Use a thermomixer for uniform temperature; pre-equilibrate all reagents; include at least triplicate technical replicates |
| Smearing instead of discrete bands on gel | Over-degradation; non-specific nuclease contamination; improper gel percentage | Reduce enzyme concentration or reaction time; use nuclease-free water; optimize agarose percentage for target MW range |
| Low signal in colorimetric assay | Interfering substances in buffer; insufficient reaction time for color development; outdated reagents | Use ultrapure reagents; extend color development to 30 min; prepare fresh carbazole or Morgan-Elson reagents monthly |
| SEC peak broadening | Column degradation; high sample viscosity; ionic strength mismatch | Replace SEC column if resolution declines; dilute viscous samples 1:5; match sample and mobile phase ionic strength |
9.1 Additional Optimization Recommendations
- Substrate pre-treatment: Dissolve high-MW HA overnight at 4°C with gentle rotation to ensure complete hydration without mechanical degradation.
- Enzyme titration: Perform a pilot enzyme titration (1-100 U/mL) to identify the minimum enzyme concentration achieving complete degradation within your desired timeframe.
- Buffer compatibility: If downstream applications require specific buffers (e.g., PBS for cell culture), perform a buffer exchange after quenching rather than adjusting the reaction buffer.
- Batch consistency: Always use the same lot of recombinant human hyaluronidase and HA substrate within a single study to minimize batch-to-batch variability.
Conclusion
This protocol provides a comprehensive, standardized framework for conducting in vitro hyaluronan degradation studies using recombinant human hyaluronidase. By carefully controlling substrate selection, reaction conditions, sampling strategy, and analytical readouts, researchers can generate high-quality, reproducible data suitable for ECM modeling, enzyme kinetic characterization, and drug permeability assessment. Adherence to the recommended controls and awareness of common pitfalls will ensure robust experimental outcomes and accelerate scientific discovery in glycobiology and matrix biology.
For precision ECM and enzyme kinetic research, selecting high-quality recombinant human hyaluronidase with validated specific activity is both a technical requirement and a cornerstone of experimental rigor. We encourage researchers to request detailed Certificate of Analysis (CoA) documentation from suppliers to ensure batch-to-batch consistency and reproducibility.
References
1. Stern, R., & Jedrzejas, M. J. (2006). Chem Rev, 106(3): 818-839.
2. Frost, G. I., & Stern, R. (1997). Adv Drug Deliv Rev, 97: 3-14.
3. Bookbinder, L. H., et al. (2006). J Control Release, 114(2): 230-241.
4. Garg, H. G., & Hales, C. A. (2004). Chemistry and Biology of Hyaluronan. Elsevier.
5. Cowman, M. K., et al. (2011). Glycobiology, 21(2): 219-233.