Hyaluronidase Activity Assay Protocol for Human Hyaluronidase Research
A Standardized Procedure for Quantitative PH20 Activity Determination
1. Assay Principle
Hyaluronidase is a glycosidase that catalyzes the hydrolysis of hyaluronic acid (HA), a high-molecular-weight glycosaminoglycan composed of repeating disaccharide units of D-glucuronic acid and N-acetyl-D-glucosamine linked by β-1,4 and β-1,3 glycosidic bonds. The enzymatic cleavage of these bonds reduces the viscosity of the HA solution and generates reducing sugar termini, both of which can be quantified as surrogate measures of enzyme activity.
This protocol describes a turbidimetric endpoint assay based on the formation of an acid-insoluble precipitate when undegraded HA is complexed with cetylpyridinium chloride (CPC). As hyaluronidase degrades HA, the amount of substrate available for CPC precipitation decreases proportionally, resulting in lower turbidity measured at 600 nm. The difference in absorbance between a non-enzyme control and the enzyme-containing sample correlates directly with hyaluronidase activity.
One unit of hyaluronidase activity is defined as the amount of enzyme that catalyzes the release of 1 μmol of N-acetylglucosamine reducing sugar equivalents per minute from hyaluronic acid under standard assay conditions (37°C, pH 5.0, 30 min).
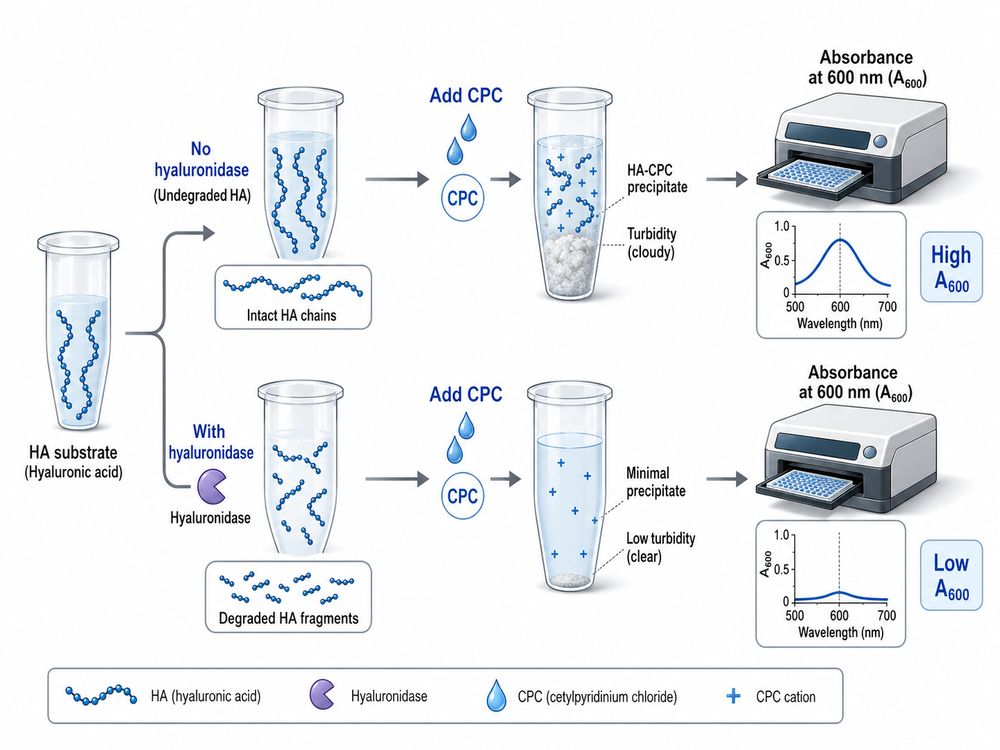
Fig 1. Schematic of the turbidimetric hyaluronidase activity assay. Undegraded HA forms a precipitate with CPC, producing measurable turbidity. Enzymatic degradation reduces precipitable substrate and thus absorbance at 600 nm.
2. Reagents and Materials
2.1 Required Reagents
| Reagent | Specification | Catalog / Source | Storage |
|---|---|---|---|
| Hyaluronic acid sodium salt (from rooster comb) | MW 1.0–1.8 MDa; >95% purity | Sigma-Aldrich H5388 or equivalent | 4°C, desiccated |
| Cetylpyridinium chloride (CPC) | ACS reagent grade; ≥98% | Sigma-Aldrich C9002 or equivalent | Room temperature |
| Sodium acetate trihydrate | ACS reagent grade | General laboratory supplier | Room temperature |
| Acetic acid (glacial) | ACS reagent grade; ≥99.7% | General laboratory supplier | Room temperature |
| Sodium chloride (NaCl) | ACS reagent grade | General laboratory supplier | Room temperature |
| Bovine serum albumin (BSA) | Fraction V; ≥98% | Sigma-Aldrich A7906 or equivalent | 4°C |
| Recombinant human PH20 (positive control) | ≥95% purity by SDS-PAGE | Creative Biomart | -80°C (avoid repeated freeze-thaw) |
| N-acetyl-D-glucosamine (standard) | ≥99% purity | Sigma-Aldrich A8625 or equivalent | Room temperature, desiccated |
2.2 Equipment
| Equipment | Specification / Requirement |
|---|---|
| Spectrophotometer or microplate reader | Capable of reading absorbance at 600 nm; pathlength correction enabled |
| Water bath or heat block | Temperature stability ±0.5°C at 37°C |
| Microcentrifuge | ≥10,000 × g; refrigerated preferred |
| Analytical balance | 0.1 mg readability |
| pH meter | Calibrated daily with standard buffers (pH 4.0, 7.0, 10.0) |
| Timer | Resolution ≤1 s |
| Microcentrifuge tubes (1.5 mL) | DNase/RNase-free, low protein binding |
| 96-well microplates (clear, flat-bottom) | UV-transparent or polystyrene; pre-warmed to room temperature |
3. Sample Preparation
3.1 Recombinant Enzyme Handling
Recombinant human hyaluronidase (PH20) should be thawed rapidly in a 37°C water bath for no longer than 2 minutes, then immediately transferred to ice. Aliquot into single-use volumes (e.g., 10–20 μL) to avoid repeated freeze-thaw cycles, which can reduce specific activity by 15–25% per cycle. Dilute the stock enzyme to a working concentration of 0.5–2.0 U/mL in ice-cold assay buffer (20 mM sodium acetate, 77 mM NaCl, 0.1% BSA, pH 5.0) immediately before use. The BSA carrier is essential to prevent surface adsorption of the enzyme at low concentrations.
3.2 Dilution Scheme
Prepare a minimum of three dilutions of the test sample to ensure at least one falls within the linear range of the standard curve (typically 0.2–1.5 U/mL). A serial 1:2 dilution series in assay buffer is recommended. Record all dilution factors for final unit calculation.
| Tube | Sample Volume (μL) | Assay Buffer (μL) | Final Dilution |
|---|---|---|---|
| Stock | — | — | 1× |
| Dilution 1 | 50 | 50 | 2× |
| Dilution 2 | 50 (from Dilution 1) | 50 | 4× |
| Dilution 3 | 50 (from Dilution 2) | 50 | 8× |
3.3 Positive and Negative Controls
Positive control: A calibrated batch of recombinant human PH20 with a known specific activity (e.g., 1,000 U/mg). The positive control should yield an activity value within ±10% of its certified reference value. If deviation exceeds 15%, the entire assay run should be rejected.
Negative control (blank): Assay buffer substituted for enzyme. This control establishes the maximum turbidity (A600,max) corresponding to 0% substrate degradation. All sample absorbance values are subtracted from this blank to calculate relative activity.
Substrate-only control: HA substrate incubated without enzyme and without CPC precipitation step, to assess non-enzymatic substrate degradation during the assay interval.
4. Substrate Preparation
4.1 Hyaluronic Acid Stock Solution
Dissolve hyaluronic acid sodium salt in deionized water (18.2 MΩ·cm) to a concentration of 2.0 mg/mL. Gentle hydration at 4°C overnight is required; do not vortex or shake vigorously, as mechanical shear can reduce the molecular weight of the substrate and alter enzyme kinetics. A magnetic stir bar at low speed (≤100 rpm) for 2–3 hours at room temperature is an acceptable alternative if time-constrained.
4.2 Critical Preparation Notes
- Molecular weight consistency: HA from different biological sources (rooster comb vs. Streptococcus) exhibits different susceptibilities to hyaluronidase. Always use the same lot or source for an entire study. If lot changes are unavoidable, cross-validate the new lot against the old using the positive control.
- Concentration verification: Determine the actual HA concentration by the carbazole method or by measuring hexuronic acid content. Nominal weights can deviate by ±5% due to residual moisture and salt content.
- Storage stability: The 2.0 mg/mL HA stock is stable for 7 days at 4°C. For longer storage, aliquot and freeze at -20°C for up to 3 months. Avoid more than two freeze-thaw cycles.
- Working substrate: Dilute the stock 1:1 with 100 mM sodium acetate buffer (pH 5.0) immediately before the assay to yield a final substrate concentration of 1.0 mg/mL in the reaction mixture.
HA solutions are viscous and prone to pipetting errors. Pre-wet pipette tips and use reverse-pipetting technique for accurate dispensing. Inaccurate substrate volume is the leading cause of poor inter-assay reproducibility.
5. Reaction Setup
5.1 Reaction Conditions
| Parameter | Standard Condition | Acceptable Range | Rationale |
|---|---|---|---|
| Temperature | 37.0 ± 0.5°C | 36.5–37.5°C | Physiological temperature; Q10 ≈ 2.0 for PH20 |
| pH | 5.00 ± 0.05 | 4.90–5.10 | Optimal for human PH20; activity drops >30% at pH 6.0 |
| Ionic strength | 77 mM NaCl | 50–150 mM | Stabilizes enzyme; higher salt inhibits substrate binding |
| Substrate concentration | 1.0 mg/mL HA | 0.8–1.2 mg/mL | Saturating conditions; Km ≈ 0.3 mg/mL |
| Reaction volume | 200 μL (microplate) or 1.0 mL (tube) | ±10% | Scalable with proportional reagent adjustment |
| Incubation time | 30 minutes | 20–40 minutes | Linear phase of product formation |
5.2 Step-by-Step Protocol
Step 1: Pre-incubation
Pre-warm the water bath or heat block to 37°C. Pre-warm all reagents (except enzyme) to 37°C for 10 minutes. Prepare a reaction worksheet assigning wells or tubes for blanks, standards, positive controls, and unknown samples in duplicate or triplicate.
Step 2: Reaction initiation
In a 1.5 mL microcentrifuge tube or 96-well microplate, combine the following in order:
- 100 μL of 2× substrate working solution (pre-warmed)
- 80 μL of 2.5× assay buffer (pre-warmed)
- 20 μL of enzyme sample or control (kept on ice until addition)
Mix gently by pipetting (do not vortex). Immediately transfer to the 37°C incubator and start the timer.
Step 3: Reaction termination
After exactly 30 minutes, terminate the reaction by adding 200 μL of ice-cold stop solution (50 mM acetic acid, pH 3.0, pre-chilled to 4°C). For microplate assays, transfer the entire reaction mixture to a fresh plate containing stop solution. The acidic pH immediately denatures the enzyme and halts all catalytic activity.
Step 4: Precipitation step
Add 1.0 mL of 2.5% (w/v) cetylpyridinium chloride in 50 mM acetic acid to each tube. For microplate format, add 100 μL of 5% CPC. Mix thoroughly and incubate at room temperature for 10 minutes to allow complete precipitation of undegraded HA. Centrifuge at 3,000 × g for 10 minutes (tube format) or read turbidity directly (microplate format after brief shaking).
6. Signal Detection
6.1 Turbidimetric Endpoint Reading
Following CPC precipitation and centrifugation, carefully aspirate the supernatant without disturbing the pellet. Resuspend the pellet in 200 μL of distilled water and measure absorbance at 600 nm (A600) against a water blank. Alternatively, in the microplate format, measure A600 directly in the plate after a brief 30-second shake to homogenize the precipitate.
The percentage of HA degradation is calculated as:
% HA Degradation = [(Ablank − Asample) / Ablank] × 100
where Ablank is the absorbance of the negative control (no enzyme) and Asample is the absorbance of the enzyme-containing reaction.
6.2 Alternative Detection Methods
| Method | Principle | Detection Wavelength | Advantages | Limitations |
|---|---|---|---|---|
| Turbidimetric (CPC) | Precipitation of undegraded HA | 600 nm | Simple; no specialized reagents beyond CPC | Endpoint only; narrow linear range |
| Reducing sugar (Nelson-Somogyi) | Colorimetric quantification of reducing sugars released | 540 nm | Direct measure of catalytic turnover | Interference from buffer components; longer protocol |
| Reducing sugar (DNSA) | 3,5-Dinitrosalicylic acid reacts with reducing termini | 575 nm | High sensitivity; well-established | Requires boiling step; color instability |
| Fluorometric (Morgan-Elson) | Fluorescent derivative of N-acetylglucosamine | Ex/Em: 360/450 nm | Highest sensitivity; suitable for low-activity samples | Complex derivatization; specialized equipment |
For PH20 activity assay applications requiring high throughput, the turbidimetric microplate format is recommended. For kinetic characterization or samples with very low activity, the Nelson-Somogyi or fluorometric Morgan-Elson method provides superior sensitivity and dynamic range.
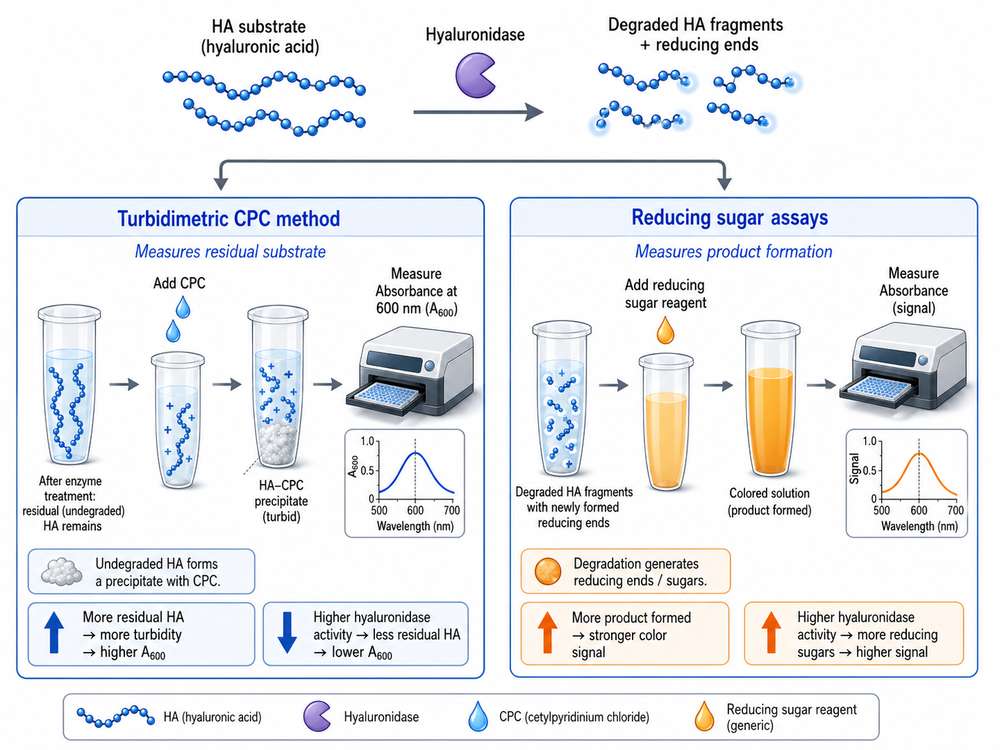
Fig 2. Comparison of signal detection methods for hyaluronidase activity quantification. The turbidimetric CPC method (left) measures residual substrate, while reducing sugar assays (right) measure product formation.
7. Standard Curve and Unit Calculation
7.1 N-Acetylglucosamine Standard Curve (for Reducing Sugar Methods)
Prepare a series of N-acetylglucosamine (GlcNAc) standards in assay buffer at concentrations of 0, 0.05, 0.10, 0.25, 0.50, 0.75, 1.00, and 1.50 mM. Process these standards through the same detection chemistry (Nelson-Somogyi or DNSA) as the unknown samples. Plot absorbance versus GlcNAc concentration and fit with a linear regression. The correlation coefficient (R2) must be ≥0.995; otherwise, repeat the standard curve preparation.
| Standard Tube | GlcNAc Stock (mM) | Volume (μL) | Assay Buffer (μL) | Final [GlcNAc] (mM) |
|---|---|---|---|---|
| S0 (Blank) | 0 | 0 | 200 | 0 |
| S1 | 10 | 10 | 190 | 0.50 |
| S2 | 10 | 20 | 180 | 1.00 |
| S3 | 10 | 30 | 170 | 1.50 |
| S4 | 10 | 40 | 160 | 2.00 |
| S5 | 10 | 50 | 150 | 2.50 |
| S6 | 10 | 75 | 125 | 3.75 |
| S7 | 10 | 100 | 100 | 5.00 |
7.2 Unit Calculation
Calculate enzyme activity using the following formula:
Activity (U/mL) = ([GlcNAc] × Vtotal) / (t × Venzyme × DF)
where:
- [GlcNAc] = concentration of GlcNAc released (μmol/mL), determined from the standard curve
- Vtotal = total reaction volume (mL)
- t = reaction time (minutes)
- Venzyme = volume of enzyme sample added (mL)
- DF = dilution factor of the enzyme sample
For the turbidimetric assay, construct a standard curve using dilutions of a calibrated hyaluronidase standard (e.g., 0, 0.25, 0.50, 0.75, 1.00, 1.50 U/mL) and plot % HA degradation versus enzyme concentration. The relationship is linear within the range of 20–80% degradation. Extrapolate unknown sample activity from this curve.
7.3 Specific Activity
When the protein concentration of the enzyme preparation is known (determined by BCA or Bradford assay), calculate specific activity as:
Specific Activity (U/mg) = Activity (U/mL) / Protein Concentration (mg/mL)
Report specific activity with appropriate significant figures (typically three) and include the assay conditions in the methods section of any publication.
8. Troubleshooting
| Problem | Possible Cause | Solution |
|---|---|---|
| High background absorbance (Ablank > 1.2) | Insufficient CPC concentration; incomplete precipitation; contaminated HA stock | Verify CPC solution is freshly prepared (≤7 days old); increase CPC to 3%; replace HA stock |
| Poor linearity (R2 < 0.98) | Substrate concentration below Km; enzyme concentration too high; substrate depletion | Increase HA to 1.5 mg/mL; dilute enzyme further; reduce incubation time to 15 min |
| High inter-assay CV (>15%) | Inconsistent substrate preparation; temperature fluctuations; pipetting error with viscous HA | Prepare substrate master batch; verify water bath stability with thermometer; use reverse pipetting |
| Low activity in positive control (<80% expected) | Enzyme inactivation during freeze-thaw; incorrect pH; expired reagents | Use fresh enzyme aliquot; recalibrate pH meter; check reagent expiration dates |
| Negative values for % degradation | Sample absorbance exceeds blank; sample contains interfering turbidity | Centrifuge sample at 10,000 × g for 5 min before assay; check for particulate contamination |
| Plate edge effects in microplate format | Uneven temperature distribution; evaporation from outer wells | Use a heated lid or sealant; avoid outer wells for critical samples; fill outer wells with buffer |
| Non-linear standard curve at high enzyme concentrations | Substrate exhaustion; product inhibition; enzyme aggregation at high concentration | Restrict assay to 20–80% degradation range; dilute samples to fall within linear zone |
9. Data Reporting Checklist
To ensure reproducibility and compliance with journal reporting standards, include the following information when publishing hyaluronidase activity assay data:
| Category | Required Information |
|---|---|
| Enzyme source | Species, isoform (e.g., human PH20), expression system, lot number, purity (%) |
| Substrate | Source (e.g., rooster comb), molecular weight range, supplier, catalog number, concentration |
| Assay conditions | Buffer composition and pH, temperature (±tolerance), reaction time, reaction volume |
| Detection method | Turbidimetric (CPC), reducing sugar (specify method), fluorometric; instrument model |
| Standard curve | Standard substance, concentration range, R2 value, equation |
| Unit definition | Explicit definition of "1 Unit" under the reported conditions |
| Quality control | Positive control value (mean ± SD), inter-assay CV (%), number of replicates |
| Data presentation | Mean ± SD or SEM; number of independent experiments; statistical test used |
Always report the specific activity (U/mg) rather than raw activity (U/mL) when comparing different hyaluronidase preparations or batches. Raw activity values are confounded by protein concentration and are not comparable across studies.
References
1. Stern, R., & Jedrzejas, M. J. (2006). Chem Rev, 106(3): 818-839.
2. Frost, G. I., & Stern, R. (1997). Int J Cancer, 73(6): 879-886.
3. Arming, S., & Strobl, B. (1997). Eur J Biochem, 247(3): 1113-1119.
4. Takahashi, T., et al. (2003). J Biol Chem, 278(8): 5598-5604.
5. Reissig, J. L., et al. (1955). J Biol Chem, 217(2): 959-966.
6. Morgan, W. T., & Elson, L. A. (1934). Biochem J, 28(3): 988-995.
7. Somogyi, M. (1952). J Biol Chem, 195(1): 19-23.
8. Miller, G. L. (1959). Anal Chem, 31(3): 426-428.