
Acid Alpha-Glucosidase Activity Assay Protocol for Recombinant GAA Characterization
A Practical 4-MUG and Glycogen-Based Workflow for Measuring Recombinant GAA Activity
Abstract
Acid alpha-glucosidase (GAA) activity is a central quality attribute for recombinant GAA used in biochemical characterization, Pompe disease research, stability studies, formulation development, and lot-to-lot comparability. The most widely used laboratory format measures hydrolysis of 4-methylumbelliferyl-α-D-glucopyranoside (4-MUG), which releases fluorescent 4-methylumbelliferone (4-MU). Glycogen-based assays provide a complementary, more physiologically relevant readout by quantifying glucose or reducing sugars released from a polymeric substrate.
This protocol presents a practical starting workflow for purified recombinant enzyme. Exact substrate concentration, enzyme dilution, reaction time, plate-reader settings, and acceptance criteria should be verified for the specific reagent, instrument, and intended use. The method is designed for research use and is not a clinical diagnostic procedure.
GAA activity assay, acid alpha-glucosidase assay protocol, recombinant GAA activity, 4-MUG assay, lysosomal enzyme assay, Pompe disease assay
1. Purpose of GAA Activity Testing
Activity testing determines whether a recombinant GAA preparation can catalyze α-glucosidic bond hydrolysis under acidic conditions. It is useful for release testing, formulation screening, freeze-thaw studies, thermal stress studies, pH profiling, inhibitor testing, and comparison of production lots. When normalized to protein concentration, the result is reported as specific activity and can reveal changes that are not visible by purity analysis alone.
For studies involving cellular uptake or lysosomal glycogen clearance, biochemical activity should be interpreted together with glycosylation, mannose-6-phosphate content, receptor-mediated uptake, and intracellular localization. A strong 4-MUG signal confirms catalytic competence against a small artificial substrate, but it does not independently prove efficient lysosomal delivery.
The assay is especially relevant when characterizing recombinant human acid alpha-glucosidase, evaluating storage conditions, or establishing comparability between reference and test enzyme preparations.
2. Assay Principle
2.1 Fluorometric 4-MUG Method
GAA hydrolyzes 4-MUG to release glucose and 4-MU. At acidic reaction pH, 4-MU fluorescence is relatively weak. Addition of an alkaline stop solution terminates the reaction and converts 4-MU into a strongly fluorescent form. Fluorescence is then converted to product concentration using a 4-MU calibration curve prepared in the same final matrix.
2.2 Glycogen-Based Method
In the biochemical substrate format, GAA hydrolyzes α-1,4 and α-1,6 linkages in glycogen. Product formation can be measured with a glucose oxidase/peroxidase reagent, a hexokinase-based glucose assay, or a reducing-sugar method. This format is less sensitive than 4-MUG but provides information closer to the natural substrate reaction.
| Assay Format | Primary Readout | Main Advantage | Important Limitation |
|---|---|---|---|
| 4-MUG fluorometric assay | Fluorescent 4-MU | High sensitivity, low sample consumption, microplate compatible | Artificial small-molecule substrate; may not reflect glycogen turnover |
| Glycogen + glucose assay | Released glucose | Closer to native substrate hydrolysis | Background glucose and coupled-reagent interference must be controlled |
| Glycogen + reducing-sugar assay | Reducing ends | Does not require a glucose-specific enzymatic kit | Lower specificity and possible color interference |

Figure 1: Recommended workflow for fluorometric recombinant GAA activity measurement. Figure title is not embedded in the image.
3. Common Substrates: 4-MUG and Glycogen-Based Readouts
| Reagent | Recommended Role | Preparation Notes |
|---|---|---|
| 4-Methylumbelliferyl-α-D-glucopyranoside | Primary fluorogenic substrate | Prepare according to supplier solubility guidance; protect from light; avoid repeated freeze-thaw cycles |
| 4-Methylumbelliferone | Product standard | Prepare a concentrated stock in a compatible solvent, then dilute into the final stopped-reaction matrix |
| Purified glycogen | Natural-substrate-like activity assessment | Use a well-characterized source; prepare fresh or aliquot; verify low free-glucose background |
| Reference GAA | Positive control and inter-run bridge | Use the same lot across a study when possible and track long-term control-chart performance |
A useful strategy is to use 4-MUG for routine screening and specific activity determination, then confirm selected samples with a glycogen-based method. For alglucosidase alfa characterization, orthogonal biochemical and cell-based assays provide stronger evidence than a single substrate format.
4. Recommended Buffer and pH Conditions
The following conditions are practical starting points for purified recombinant GAA. They should be optimized using enzyme-dilution, time-course, substrate-saturation, and pH-profile experiments before routine use.
| Component | Recommended Starting Condition | Purpose or Caution |
|---|---|---|
| Reaction buffer | 50–100 mM sodium acetate or citrate, pH 4.0 | Provides an acidic environment compatible with lysosomal GAA catalysis |
| 4-MUG substrate | 0.5–2.0 mM final concentration | Begin near 1 mM; verify that the chosen level is not rate limiting |
| Reaction temperature | 37°C | Use a pre-equilibrated block or plate incubator and minimize edge effects |
| Reaction time | 15–60 minutes | Select a period within the linear product-formation window |
| Stop solution | 0.2–0.5 M glycine-carbonate or glycine-NaOH, approximately pH 10.5–11 | Stops hydrolysis and enhances 4-MU fluorescence |
| Optional BSA | 0.01–0.1% assay-grade BSA | May reduce surface adsorption at very low enzyme concentrations; confirm no assay interference |
Do not select enzyme concentration and reaction time only for maximum signal. Select conditions that remain linear with both time and enzyme dilution, and keep all samples within the validated standard-curve range.
5. Sample Preparation
- Thaw the recombinant GAA sample on ice or according to the product-specific instructions. Mix by gentle inversion; avoid vigorous vortexing and foaming.
- Inspect for visible particles, precipitation, or discoloration. Record any abnormal appearance before testing.
- Determine protein concentration using a validated method such as A280 with an appropriate extinction coefficient, BCA, or another qualified assay.
- Dilute the enzyme in cold reaction buffer or an assay diluent that preserves activity. Prepare at least three enzyme dilutions during method development.
- Keep diluted enzyme on ice and minimize the hold time before starting the reaction.
- For formulated products, prepare a formulation-matched blank because excipients may influence fluorescence or coupled colorimetric readouts.
For lot-to-lot comparison, use the same dilution buffer, plate type, incubation device, reader settings, and reaction timing. Small procedural differences can create apparent activity shifts even when the enzyme itself is unchanged.
6. Standard Curve and Controls
6.1 4-MU Standard Curve
Prepare a multi-point 4-MU standard curve that brackets all expected sample signals. A typical starting range is 0–20 µM final 4-MU, although the optimal range depends on plate volume, reader gain, optics, and stop-buffer composition. Standards must be prepared in the same final alkaline matrix as stopped reactions.
6.2 Recommended Controls
| Control | Composition | Purpose |
|---|---|---|
| Substrate blank | Substrate + buffer, no enzyme | Measures substrate autohydrolysis and reagent fluorescence |
| Enzyme blank | Enzyme + buffer, no substrate | Detects sample autofluorescence or matrix interference |
| Zero-time control | Stop solution added before enzyme or substrate | Measures signal unrelated to incubation-dependent catalysis |
| Heat-inactivated enzyme | Denatured test sample | Confirms that product formation is enzyme dependent |
| Reference GAA | Qualified active control | Monitors run validity and enables inter-run comparison |
| Matrix spike | Known 4-MU or enzyme added to sample matrix | Evaluates quenching, enhancement, or recovery |
7. Reaction Setup
7.1 Example 96-Well 4-MUG Procedure
| Step | Example Volume per Well | Procedure |
|---|---|---|
| 1. Add substrate solution | 40 µL | Dispense prewarmed 2× 4-MUG substrate in acidic buffer |
| 2. Add enzyme sample | 40 µL | Add diluted recombinant GAA to initiate the reaction |
| 3. Incubate | 80 µL total | Incubate at 37°C for the validated time, protected from light |
| 4. Stop reaction | 120 µL | Add alkaline stop solution in the same order and timing used to start wells |
| 5. Measure | 200 µL final | Mix gently, remove bubbles, and read fluorescence promptly |
This layout gives a 1:1 substrate-to-sample mixing ratio. Other volumes are acceptable if final concentrations, optical performance, and reaction timing are controlled. Run samples in duplicate at minimum; triplicates are preferred during method development.
7.2 Example Glycogen-Based Procedure
- Prepare glycogen in sodium acetate buffer, pH approximately 4.0.
- Combine substrate and diluted GAA and incubate at 37°C within the established linear range.
- Terminate the reaction by heat treatment or by the method specified for the downstream glucose-detection reagent.
- Quantify released glucose using a glucose standard curve and subtract both enzyme-matrix and glycogen blanks.
- Confirm that the detection reagent is not inhibited by acetate, citrate, excipients, or residual sample components.
8. Fluorescence or Absorbance Measurement
For the 4-MUG assay, a common starting setting is excitation at approximately 355–365 nm and emission at approximately 445–455 nm. An example is Ex 360 nm/Em 450 nm. Use the reader's optical configuration and 4-MU spectral response to select the final settings. Maintain constant gain, focal height, integration time, and plate type across comparative runs.
For glycogen-based assays, measure at the wavelength specified by the selected glucose or reducing-sugar reagent. Include color-matched sample blanks when the enzyme formulation contains components that absorb in the same region.
- Use black plates for fluorescence and clear plates for absorbance.
- Avoid bubbles, fingerprints, condensation, and large temperature differences across the plate.
- Read standards and samples within a consistent interval after stopping.
- Reject or repeat wells affected by dispensing errors or visible artifacts according to predefined rules.
9. Data Analysis and Activity Calculation
9.1 Blank Correction and Standard-Curve Conversion
Subtract the appropriate blank from each raw signal. Fit the 4-MU standard curve using a model justified by the observed range, usually linear regression when detector response is linear. Convert corrected sample fluorescence to the amount of 4-MU formed.
9.2 Activity Formula
Activity (U/mL) = [µmol of product formed × dilution factor] ÷ [reaction time (min) × enzyme volume in the reaction (mL)]
One unit is commonly defined as the amount of enzyme that releases 1 µmol of product per minute under the stated assay conditions. The unit definition must always be reported with substrate, pH, temperature, and reaction time.
Specific activity (U/mg) = Activity (U/mL) ÷ protein concentration (mg/mL)
For example, if a diluted sample forms 0.004 µmol 4-MU in 30 minutes using 0.040 mL of enzyme solution, and the dilution factor is 10:
Activity = (0.004 × 10) ÷ (30 × 0.040) = 0.0333 U/mL
If the original enzyme concentration is 0.020 mg/mL, the specific activity is 1.67 U/mg.
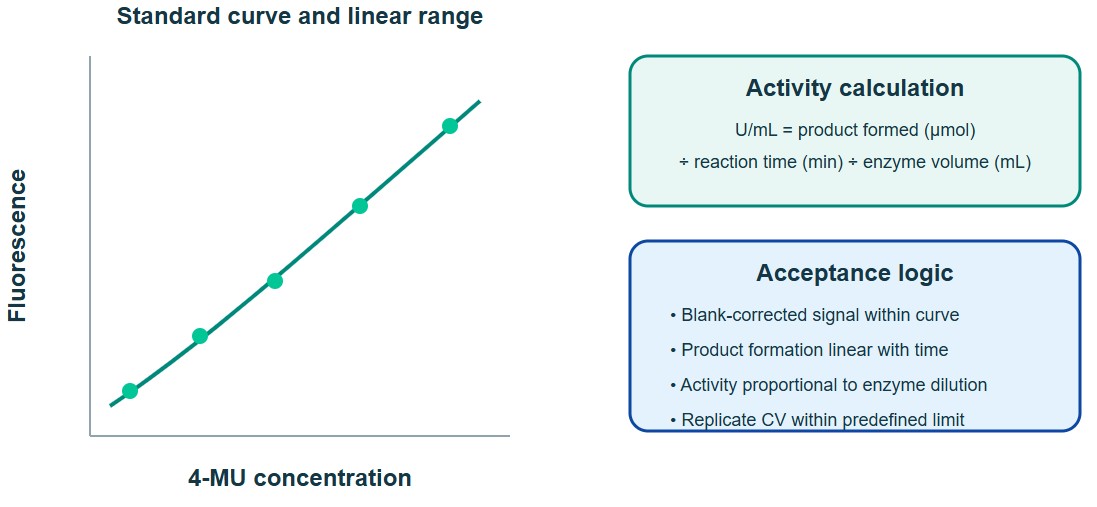
Figure 2: Standard-curve conversion, activity calculation, and acceptance logic. Figure title is not embedded in the image.
9.3 Recommended Run Acceptance Checks
| Parameter | Example Development Target | Interpretation |
|---|---|---|
| Standard-curve fit | R² ≥ 0.99 within the validated range | Confirms adequate calibration; residuals should also be reviewed |
| Blank signal | Low and stable relative to the lowest standard | High blanks reduce sensitivity and may indicate substrate degradation |
| Replicate precision | CV ≤ 10% for routine research assays | Set stricter or wider limits based on method performance and intended use |
| Reference control | Within a predefined control-chart range | Supports inter-run comparability |
| Dilutional parallelism | Back-calculated activities agree across valid dilutions | Helps identify matrix interference or detector saturation |
10. Troubleshooting Low Signal, High Background, or Variability
| Observation | Likely Cause | Recommended Action |
|---|---|---|
| Low or absent signal | Enzyme too dilute, inactive enzyme, incorrect substrate isomer, unsuitable pH, short incubation | Verify substrate identity, test a fresh reference GAA, extend time within linear range, and perform a pH profile |
| Signal above highest standard | Excess enzyme, long incubation, high reader gain | Dilute sample, shorten incubation, or expand the validated standard range |
| High substrate blank | Substrate autohydrolysis, contamination, repeated thawing, prolonged warming | Prepare fresh substrate, protect from light, keep cold until use, and reduce preincubation time |
| High enzyme blank | Sample autofluorescence or formulation interference | Use enzyme-specific blanks, assess matrix spikes, and consider additional dilution |
| Poor replicate precision | Unequal timing, inadequate mixing, bubbles, edge effects, adsorption | Use multichannel dispensing, stagger wells systematically, centrifuge briefly, and evaluate low-binding plates or BSA |
| Nonlinear time course | Substrate depletion, product inhibition, instability, or detector saturation | Reduce enzyme amount or time and confirm substrate excess |
| Activity changes with dilution | Matrix inhibition, adsorption, aggregation, or inaccurate protein concentration | Perform spike recovery, use a compatible carrier protein, inspect by SEC, and recheck concentration |
| Glycogen assay shows high background | Free glucose in substrate or sample formulation | Use low-glucose glycogen, include complete blanks, and consider dialysis or buffer exchange |
11. Reporting Recommendations
A complete GAA activity report should allow another laboratory to understand the unit definition and reproduce the core procedure. At minimum, include:
- Identity, lot number, expression system, formulation, and storage history of the recombinant GAA.
- Protein concentration method and result.
- Substrate name, supplier, lot, and final concentration.
- Reaction buffer composition, pH, temperature, time, and total volume.
- Plate type, reader model, excitation/emission or absorbance settings, and gain mode.
- Standard-curve range, fitting model, blank-correction procedure, and dilution factor.
- Activity unit definition, volumetric activity, specific activity, replicate values, mean, standard deviation, and CV.
- Reference-control result and run-acceptance status.
- Any deviations, outlier exclusions, sample appearance changes, or freeze-thaw history.
Use biochemical activity as one component of recombinant GAA characterization. For lysosomal-delivery studies, combine it with purity, aggregation, glycosylation, M6P-related uptake, lysosomal localization, and glycogen-clearance data.
A well-documented GAA enzyme activity assay supports meaningful comparison of recombinant enzyme lots and helps distinguish true potency loss from procedural variability.
References
1. Hirschhorn, R., & Reuser, A. J. J. (2001). Glycogen storage disease type II: acid alpha-glucosidase deficiency. In The Metabolic and Molecular Bases of Inherited Disease.
2. Moreland, R. J., et al. (2005). Lysosomal acid alpha-glucosidase consists of four different peptides processed from a single-chain precursor. Journal of Biological Chemistry, 280(8): 6780-6791.
3. Roig-Zamboni, V., et al. (2017). Structure of human lysosomal acid α-glucosidase—a guide for the treatment of Pompe disease. Nature Communications, 8: 1111.
4. van Diggelen, O. P., et al. (2009). Enzyme analysis for Pompe disease in leukocytes, fibroblasts and muscle. Clinical Chemistry, 55(1): 147-154.
5. Umapathysivam, K., et al. (2001). Determination of acid alpha-glucosidase protein: evaluation as a screening marker for Pompe disease and other lysosomal storage disorders. Clinical Chemistry, 47(8): 1378-1383.
6. Chamoles, N. A., et al. (2004). Glycogen storage disease type II: enzymatic screening in dried blood spots on filter paper. Clinica Chimica Acta, 347(1-2): 97-102.
7. Zhang, H., et al. (2006). A simple and reliable fluorometric method for determination of acid alpha-glucosidase activity in dried blood spots. Clinica Chimica Acta, 372(1-2): 98-102.
8. Li, Y., et al. (2022). Development of a clinically validated in vitro functional assay to assess GAA variants associated with Pompe disease. Frontiers in Genetics, 13: 931562.
9. Zhu, Y., et al. (2009). Glycoengineered acid alpha-glucosidase with improved efficacy in a mouse model of Pompe disease. Molecular Therapy, 17(6): 954-963.
10. European Medicines Agency. Myozyme: EPAR Product Information and Assessment Reports.
11. U.S. Food and Drug Administration. Lumizyme (alglucosidase alfa) Prescribing Information and regulatory reviews.
12. ICH Q2(R2). Validation of Analytical Procedures.
13. ICH Q6B. Specifications: Test Procedures and Acceptance Criteria for Biotechnological/Biological Products.
14. United States Pharmacopeia. General chapters covering analytical procedure validation, enzyme assays, and biotechnology-derived proteins.