Protocol: Evaluating Imiglucerase Activity in Gaucher Disease Cell Models
Standardized Method for Glucocerebrosidase Enzyme Activity Assessment Using 4-MUG Fluorometric Assay
Abstract
Gaucher disease (GD) is the most prevalent lysosomal storage disorder, caused by mutations in the GBA1 gene encoding lysosomal glucocerebrosidase (GCase). This deficiency leads to accumulation of glucosylceramide and glucosylsphingosine in macrophages and neuronal cells. Imiglucerase (Cerezyme®) is a recombinant human GCase representing the gold standard for enzyme replacement therapy (ERT) in Type 1 Gaucher disease.
This protocol provides a standardized methodology for evaluating Imiglucerase biological activity in disease-relevant cellular models, utilizing patient-derived induced pluripotent stem cells (iPSCs) and the fluorogenic substrate 4-methylumbelliferyl-β-D-glucopyranoside (4-MUG) for quantitative enzyme activity measurement. The method enables preclinical assessment of biosimilar products, investigation of cellular uptake mechanisms, and optimization of dosing strategies in personalized medicine.
imiglucerase assay protocol, glucocerebrosidase activity assay, Gaucher disease cell model, enzyme replacement therapy, 4-MUG substrate assay, iPSC macrophage differentiation
1. Background
Gaucher disease (GD) is the most prevalent lysosomal storage disorder (LSD), caused by mutations in the GBA1 gene encoding lysosomal glucocerebrosidase (GCase, EC 3.2.1.45). This deficiency leads to accumulation of glucosylceramide (GluCer) and glucosylsphingosine (GluSph) in macrophages and neuronal cells, resulting in hepatosplenomegaly, cytopenia, bone disease, and neurological symptoms in severe forms.
Imiglucerase (Cerezyme®) is a recombinant human GCase produced in Chinese hamster ovary (CHO) cells, representing the gold standard for enzyme replacement therapy (ERT) in Type 1 Gaucher disease. Evaluating its biological activity in disease-relevant cellular models is critical for:
- Preclinical assessment of biosimilar products
- Investigation of cellular uptake mechanisms via mannose receptors
- Optimization of dosing strategies in personalized medicine
- Development of combination therapies with pharmacological chaperones
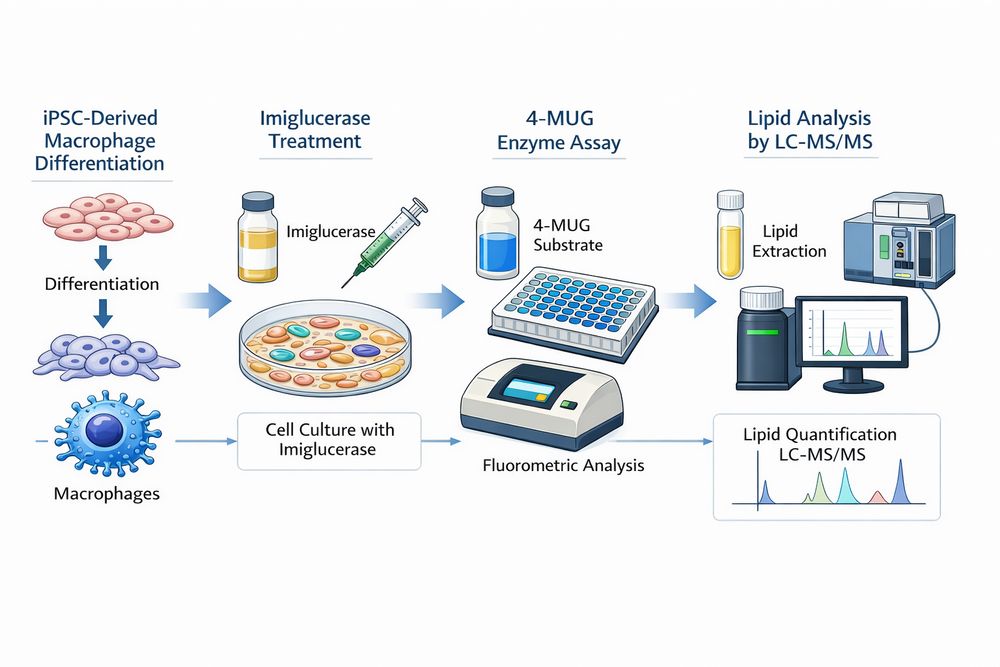
Fig 1. Imiglucerase Activity Assay Workflow in Gaucher Disease Cell Models. The protocol encompasses iPSC-derived macrophage differentiation, Imiglucerase treatment, 4-MUG fluorometric enzyme assay, and lipid substrate quantification by LC-MS/MS.
2. Materials and Reagents
2.1 Cell Culture Materials
| Item | Supplier | Catalog # | Notes |
|---|---|---|---|
| iPSC lines (GD patient-derived: N370S/N370S, L444P/L444P) | Coriell Institute | Various | Type 1, 2, 3 GD genotypes |
| Control iPSC lines (WT GBA1) | WiCell | Various | Age/sex-matched controls |
| mTeSR™ Plus medium | Stemcell Technologies | 100-0276 | iPSC maintenance |
| Matrigel® hESC-Qualified Matrix | Corning | 354277 | Coating for iPSC culture |
| Recombinant human GM-CSF | PeproTech | 300-03 | Macrophage differentiation |
2.2 Imiglucerase and Assay Reagents
| Item | Supplier | Catalog # | Function |
|---|---|---|---|
| Imiglucerase (recombinant human glucocerebrosidase) | Creative BioMart | Enzyme-therapeutic grade | ERT agent for treatment |
| 4-Methylumbelliferyl-β-D-glucopyranoside (4-MUG) | Sigma-Aldrich | M3633 | Fluorogenic substrate |
| 4-Methylumbelliferone (4-MU) | Sigma-Aldrich | M1381 | Calibration standard |
| Conduritol B epoxide (CBE) | Sigma-Aldrich | C5424 | Specific GCase inhibitor |
| Sodium taurocholate | Sigma-Aldrich | 86339 | Lysosomal membrane solubilizer |
3. Preparation of Gaucher Disease Cell Lines
3.1 iPSC Culture and Quality Control
1Maintenance: Culture iPSCs on Matrigel-coated plates in mTeSR™ Plus medium at 37°C, 5% CO₂. Passage every 5-7 days using Accutase (5-7 minutes, 37°C) at 1:6 to 1:10 split ratio.
2Authentication: Confirm pluripotency by flow cytometry (TRA-1-60, SSEA-4 >90%) and karyotyping (G-banding) quarterly.
3Genotyping: Verify GBA1 mutations by Sanger sequencing and confirm absence of recombination events.
3.2 Macrophage Differentiation (Type 1 GD Modeling)
Step 1: Embryoid Body Formation
Dissociate iPSCs into single cells (Accutase) and culture in ultra-low attachment plates in differentiation medium (DMEM/F12, 20% FBS, 1% NEAA, 100 ng/mL GM-CSF).
Step 2: Hematopoietic Progenitor Expansion
After 7 days, transfer EBs to gelatin-coated plates and expand in medium supplemented with GM-CSF (50 ng/mL) and IL-3 (25 ng/mL) for 14 days.
Step 3: Macrophage Maturation
Harvest floating cells and culture in RPMI 1640 + 10% FBS + 50 ng/mL M-CSF for additional 7 days. Confirm CD14⁺/CD11b⁺ phenotype by flow cytometry (>95% purity).
Include isogenic gene-corrected iPSC lines (using CRISPR/Cas9 to correct GBA1 mutations) as ideal controls to account for genetic background variability.
4. Imiglucerase Treatment Setup
4.1 Experimental Design
| Treatment Group | Description | Purpose |
|---|---|---|
| Untreated GD cells | No enzyme addition | Negative control |
| WT/control cells | Normal GCase activity | Normal activity reference |
| GD + Imiglucerase | Dose-response: 1-100 U/mL | Therapeutic efficacy testing |
| GD + CBE | 1 mM CBE | Assay specificity confirmation |
4.2 Treatment Protocol
1Cell Seeding: Plate differentiated macrophages at 1×10⁵ cells/well in 24-well plates 24 hours prior to treatment.
2Enzyme Preparation: Reconstitute Imiglucerase in sterile PBS with 0.1% BSA. Prepare working dilutions fresh.
3Administration: Add Imiglucerase to culture medium (final volume 500 μL). For macrophages, supplement with 5 μg/mL mannan to block mannose receptor-mediated uptake (parallel wells to distinguish receptor-specific vs. fluid-phase uptake).
4Incubation: Treat for 48-72 hours at 37°C, 5% CO₂. Replace medium with fresh enzyme every 24 hours for sustained exposure.
5Harvest: Wash cells 3× with ice-cold PBS to remove extracellular enzyme. Collect for enzyme assay and lipid analysis.
5. Enzyme Activity Assay
5.1 Buffer Preparation
Citrate-Phosphate Buffer (0.15 M, pH 5.4):
- Prepare 0.1 M citric acid: Dissolve 19.2 g citric acid monohydrate in 1 L dH₂O
- Prepare 0.2 M sodium phosphate: Dissolve 28.4 g Na₂HPO₄ in 1 L dH₂O
- Mix 44.2 mL citric acid + 55.8 mL sodium phosphate, verify pH 5.4 ± 0.1
Assay Buffer (prepare fresh, 500 mL):
- 500 mL citrate-phosphate buffer (pH 5.4)
- 1.25 g sodium taurocholate (0.25% w/v)
- 5 g BSA (1% w/v)
- 1 mL 0.5 M EDTA (1 mM final)
5.2 Sample Preparation
1Cell Lysis: Lyse harvested cells (1×10⁵ cells/sample) in 100 μL 1% (v/v) Triton X-100 in PBS with protease inhibitors. Incubate on ice for 15 minutes.
2Centrifugation: Clear lysates at 16,000 × g for 10 minutes at 4°C.
3Protein Quantification: Determine protein concentration using BCA assay. Normalize all samples to equivalent protein content (typically 5-20 μg per assay).
5.3 Assay Procedure
| Well Type | Contents | Purpose |
|---|---|---|
| Blank | 80 μL assay buffer | Background fluorescence |
| Calibrators | 0, 0.1, 0.5, 1, 5, 10 μM 4-MU (duplicate) | Standard curve |
| Samples | 5-20 μg protein + assay buffer to 80 μL (duplicate) | Total GCase activity |
| +CBE Control | Sample + 300 μM CBE | Non-specific activity |
| Positive Control | Purified GCase or WT cell lysate | Assay validation |
Reaction Steps:
- Pre-incubate samples ± CBE (300 μM final) for 15 minutes at room temperature
- Initiate reaction by adding 20 μL 5 mM 4-MUG (freshly prepared, final concentration 1 mM)
- Incubate at 37°C for 60 minutes (linear range confirmed by time-course)
- Terminate reaction by adding 100 μL stop buffer (glycine pH 12.5)
- Measure fluorescence immediately: Ex/Em = 365/460 nm
5.4 Specific Activity Calculation
Where specific GCase activity = (Total activity) - (CBE-resistant activity)
6. Lipid Substrate Quantification
To correlate enzyme activity with therapeutic efficacy, quantify accumulated substrates by LC-MS/MS.
6.1 Lipid Extraction (Modified Bligh & Dyer)
1Harvest: Wash cells 2× with PBS, scrape into 1 mL PBS.
2Extraction: Add 3.75 mL methanol:chloroform (2:1, v/v) + internal standard (C17-GlcCer, 50 ng).
3Homogenization: Sonicate 3× 10 seconds, vortex 2 minutes.
4Phase Separation: Add 1.25 mL chloroform + 1.25 mL water, vortex, centrifuge 1,000 × g for 10 minutes.
5Collection: Recover lower organic phase, dry under N₂ gas.
6Reconstitution: Resuspend in 100 μL methanol:chloroform (1:1) for LC-MS/MS analysis.
6.2 LC-MS/MS Parameters
| Parameter | Setting |
|---|---|
| Column | C18 reverse-phase (100 × 2.1 mm, 1.7 μm) |
| Mobile Phase A | 5 mM ammonium formate in water |
| Mobile Phase B | Acetonitrile:isopropanol (1:1) |
| Gradient | 70-98% B over 8 minutes |
| GlcCer (d18:1/16:0) | m/z 700.6 → 264.3 |
| GluSph (d18:1) | m/z 462.3 → 282.3 |
7. Data Analysis
7.1 Enzyme Activity Analysis
- Normalization: Express activity as nmol 4-MU released per mg protein per minute
- Correction: Subtract CBE-resistant background activity (<5% of total in healthy cells)
- Reference Ranges:
- Healthy control fibroblasts: 15-50 nmol/mg/min
- GD patient fibroblasts: <5 nmol/mg/min (typically 0.5-2)
- Imiglucerase-treated GD cells: Expect 30-70% of normal activity
7.2 Statistical Considerations
- Biological Replicates: Minimum n=3 independent iPSC lines per genotype
- Technical Replicates: Duplicate/triplicate assays per sample
- Analysis: One-way ANOVA with Dunnett's post-hoc test for multiple comparisons
- Effect Size: Calculate percent restoration of enzyme activity relative to WT controls
8. Troubleshooting
| Problem | Possible Cause | Solution |
|---|---|---|
| High background fluorescence | Autofluorescence from medium components | Wash cells extensively before lysis; use phenol red-free medium |
| No difference between GD and WT cells | Wrong cell type used; contamination | Verify GBA1 genotype by sequencing; confirm cell identity by STR profiling |
| CBE fails to inhibit activity | CBE degradation; wrong concentration | Prepare CBE fresh from frozen aliquots; verify 300 μM final concentration |
| High variability between replicates | Uneven cell seeding; protein precipitation | Ensure accurate cell counting; vortex lysates before protein assay |
| Imiglucerase shows no uptake | Mannose receptor blockade; wrong pH | Confirm mannose receptor expression (CD206 staining); verify assay pH 5.4 |
| Low fluorescence signal | Substrate degradation; incorrect settings | Prepare 4-MUG fresh; verify plate reader settings (Ex/Em 365/460 nm) |
References
1. Gomes S, Sammler E. Lysosomal GCase (glucocerebrosidase) activity assay. Protocols.io. 2024.
2. Williams D, et al. High-throughput screening for small-molecule stabilizers of misfolded glucocerebrosidase in Gaucher disease and Parkinson's disease. PNAS. 2024;121(40):e2406009121.
3. Mazzulli JR, et al. Enzyme Activity-Based Genome-wide Screening for Modifiers of Lysosomal Glucocerebrosidase. ACS Cent Sci. 2025.
4. Schöndorf DC, et al. iPSC-derived neurons from GBA1-associated Parkinson's disease patients show autophagic defects and impaired calcium homeostasis. Nat Commun. 2014.
5. Panicker LM, et al. Gaucher iPSC-derived macrophages produce elevated levels of inflammatory mediators and serve as a new platform for therapeutic development. Stem Cells. 2014.