Designing Experiments Using Recombinant Imiglucerase in Disease Models
A Comprehensive Guide to ERT Research Methodology and Experimental Optimization
Abstract
Enzyme replacement therapy (ERT) using recombinant imiglucerase has revolutionized the treatment landscape for Gaucher disease and serves as a paradigm for lysosomal storage disorder research. This guide provides researchers with systematic approaches for designing robust preclinical experiments utilizing imiglucerase products, ensuring reproducible results and translational relevance.
Imiglucerase, Gaucher disease, enzyme replacement therapy, D409V mouse model, glucosylceramide, preclinical research
1. Selecting Appropriate Model Systems
The selection of a disease model fundamentally determines the translatability of your imiglucerase experimental design. Different model systems offer distinct advantages depending on your research objectives.
1.1 Mouse Models: The Gold Standard
Gaucher disease mouse models remain indispensable for preclinical ERT development. The D409V/null (9V/null) mouse model, harboring a clinically relevant mutation homozygous for D409V on one allele and null on the other, develops progressive visceral and neurological manifestations that closely mimic human disease pathology.
Table 1. Comparison of Major Gaucher Disease Mouse Models for Imiglucerase Studies
| Model | Genotype | Phenotype | Best Application | Treatment Response |
|---|---|---|---|---|
| D409V/null | D409V/− | Visceral accumulation, neurodegeneration | ERT efficacy, dose-response studies | Excellent response in liver/spleen; limited lung clearance |
| 4L;C | V394L/V394L/saposin C−/− | Progressive neurological deficits, gliosis | CNS-targeted delivery studies | Responds to brain-penetrant therapies |
| Gba1 Knockout | Gba1−/− | Severe, early lethality | Pathophysiology studies | Limited viability for long-term ERT |
| Conditional Knockout | Tissue-specific deletion | Organ-specific pathology | Mechanistic studies | Variable based on target tissue |
When selecting your model, consider the age at initiation—treatment starting at 5 weeks versus 20 weeks yields different baseline pathologies and therapeutic windows.
1.2 Cellular Models for Mechanistic Studies
For high-throughput screening and uptake mechanism studies, CHO cells stably expressing human macrophage mannose receptor (hMMR) provide a quantitative platform for comparing recombinant imiglucerase cellular uptake bioactivity. These assays generate complete dose-response curves and confirm mannose receptor-mediated internalization.
1.3 Alternative Model Considerations
While murine models dominate the field, larger animal models may be necessary for specific research questions:
- Non-human primates: Pharmacokinetic studies and infusion-related reaction profiling
- Zebrafish: High-throughput genetic screening and early developmental toxicity
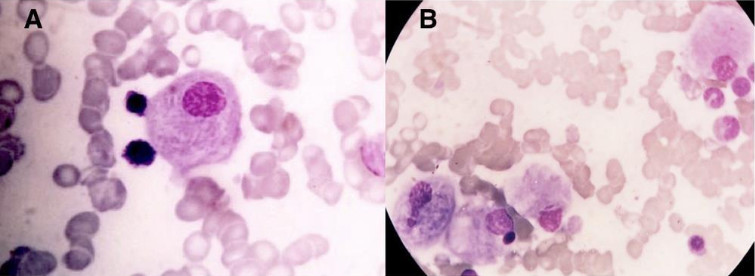
Fig 1. Typical Gaucher cells displaying characteristic "wrinkled tissue pattern" cytoplasm. Left panel shows high-power view of individual cells; right panel demonstrates clustered storage cells. Images courtesy of Hematology Image Bank.
2. Dose Optimization Strategies
Optimal dosing represents the cornerstone of successful ERT research methods. Dose selection must balance therapeutic efficacy with immunogenicity risks when using imiglucerase.
2.1 Standard Dose Ranges
Based on extensive clinical and preclinical data, imiglucerase dosing typically follows these ranges:
Table 2. Recommended Dose Tiers for Preclinical Imiglucerase Studies
| Dose Level | Units/kg/week | Clinical Correlation | Primary Outcome | Immunogenicity Risk |
|---|---|---|---|---|
| Low | 5 U/kg | Sub-therapeutic baseline | Minimal clearance, disease progression control | Low |
| Standard | 15-30 U/kg | Standard clinical dosing | Significant visceral improvement | Moderate |
| High | 60 U/kg | High-dose clinical regimen | Near-complete substrate clearance, WT levels | Elevated (IgG/IgE detection) |
2.2 Dose-Response Study Design
For comprehensive imiglucerase experimental design, implement a 12-fold dose range (5–60 U/kg/week) to capture full pharmacodynamic profiles:
- Route: Intravenous bolus injection (tail vein) mimics clinical infusion
- Frequency: Weekly administration for 8-week standard protocol
- Tissue Distribution: Expect 80%+ hepatic localization, <5% splenic/pulmonary recovery post-bolus
2.3 Dose Optimization Metrics
Monitor these parameters to determine optimal dosing:
- Glucosylceramide (GC) reduction in liver, spleen, and lung
- Gaucher cell clearance quantification
- Anti-drug antibody (ADA) development (IgG/IgE)
- Survival rates and hypersensitivity reactions
At 60 U/kg/week, imiglucerase achieves near-wild-type GC levels in liver by 8 weeks, though velaglucerase alfa may show marginally faster initial clearance (p=0.0199 at 4 weeks).
3. Treatment Schedules
Treatment scheduling significantly impacts therapeutic outcomes and must align with your study endpoints when administering imiglucerase.
3.1 Standard Treatment Protocols
Table 3. Recommended Treatment Schedules by Study Objective
| Study Objective | Duration | Frequency | Assessment Points | Model Recommendation |
|---|---|---|---|---|
| Acute PK/PD | 24-72 hours | Single dose | 2, 6, 12, 24, 48h | D409V/null |
| Short-term efficacy | 4 weeks | Weekly | Baseline, Week 2, 4 | D409V/null |
| Long-term correction | 8-12 weeks | Weekly | Every 2 weeks | D409V/null |
| Immunogenicity profiling | 8+ weeks | Bi-weekly | Every 2 weeks (serum) | D409V/null |
| CNS penetration | 12+ weeks | ICV delivery | Monthly | 4L;C or nGD models |
3.2 Administration Considerations
Intravenous Delivery: Standard bolus injection via tail vein. Ensure:
- Consistent injection volume (100-200 μL)
- Sterile technique to prevent infection confounders
- Monitoring for acute hypersensitivity (cyanosis, tachypnea, tachycardia)
Alternative Delivery Routes:
- Intracerebroventricular (ICV): For neuronopathic disease studies—imiglucerase ICV delivery improves survival in nGD mice
- Subcutaneous: Investigating sustained-release formulations
3.3 Scheduling for Combination Therapy
Emerging research supports combining imiglucerase ERT with autophagy inducers (e.g., rapamycin/CCI-779) for enhanced substrate clearance. When designing combination studies:
- Stagger administrations to distinguish individual effects
- Include monotherapy controls for both agents
- Extend observation periods to capture synergistic effects
4. Measuring Treatment Outcomes
Comprehensive outcome assessment requires multimodal approaches spanning biochemical, histological, and molecular endpoints when evaluating imiglucerase efficacy.
4.1 Biochemical Endpoints
Primary Biomarkers:
| Biomarker | Method | Expected Change | Timeline |
|---|---|---|---|
| Tissue Glucosylceramide (GC) | Mass spectrometry/LC-MS | 60-95% reduction in liver; 10-30% in spleen | 4-8 weeks |
| Plasma Chitotriosidase | Enzymatic assay | Correlates with macrophage burden | 2-4 weeks |
| CCL18/PARC | ELISA | Marker of Gaucher cell activation | 4-8 weeks |
| Acid β-glucosidase activity | Fluorometric assay (4-MU-Glc substrate) | Restoration in tissue homogenates | Post-sacrifice |
4.2 Histopathological Assessment
Quantitative Morphometry:
- Gaucher cell counting: Stain with hematoxylin-eosin or toluidine blue; quantify cells per high-power field in liver, spleen, and lung sections
- Storage material scoring: 0-4 scale based on cytoplasmic inclusion density
4.3 Molecular and Transcriptomic Analysis
Advanced ERT research methods now incorporate transcriptomic profiling to understand tissue-specific molecular responses to imiglucerase:
- mRNA-Seq: Identifies ~3-fold more differentially expressed genes (DEGs) than microarrays
- Pathway Analysis: Focus on cell division/proliferation, hematopoietic system, and inflammatory/macrophage response networks
- DESeq/edgeR: Preferred analytic tools for DEG identification
Post-therapy transcriptomes in liver and spleen approximate wild-type profiles, while lung tissue shows minimal transcriptional change—consistent with limited pulmonary enzyme delivery.
4.4 Immunogenicity Monitoring
Critical for high-dose imiglucerase studies:
| Timepoint | Assay | Cut-off | Clinical Relevance |
|---|---|---|---|
| Baseline | Anti-imiglucerase IgG screening | Background level | Establish baseline |
| Week 2, 4, 6, 8 | IgG quantification (ECL/RIPA) | >3× background | Predicts infusion reactions |
| Week 4, 8 | IgE subclass analysis | >0.55 ng/mL | Anaphylaxis risk |
| Week 8 | Neutralizing antibody assay | >20% inhibition | Therapeutic efficacy impact |
At 60 U/kg/week, 21-34% of treated mice develop IgE-mediated acute hypersensitivity leading to death. Implement rescue protocols and consider antihistamine prophylaxis.
5. Statistical Considerations
Rigorous statistical planning ensures your imiglucerase experimental design yields publishable, reproducible results.
5.1 Power Analysis and Sample Size
Minimum Group Sizes (based on effect sizes from published studies):
| Endpoint | Expected Effect Size | CV% | Required n/group | Power |
|---|---|---|---|---|
| Hepatic GC reduction | 70-85% decrease | 15-20 | 6-8 | 0.90 |
| Gaucher cell clearance | 60-95% reduction | 25-30 | 8-10 | 0.85 |
| Survival analysis | HR 0.3 | - | 10-12 | 0.80 |
| Transcriptomic DEGs | 2-fold change | 30-40 | 3-4 (RNA-Seq) | 0.90 |
5.2 Experimental Design Recommendations
- Randomization: Stratify by baseline body weight and disease severity biomarkers (e.g., plasma chitotriosidase) before randomizing to treatment arms.
- Blinding: Ensure blinded histopathological assessment and biomarker quantification to minimize observer bias.
- Controls:
- Vehicle-only (saline) controls
- Wild-type littermates for normalization
- Reference standard (velaglucerase alfa) for comparator studies
5.3 Statistical Methods
Primary Analysis:
- Mixed Model ANOVA: For repeated measures (longitudinal biomarkers)
- Two-way ANOVA: For dose × time interactions
- Kaplan-Meier with Log-rank test: For survival endpoints
Transcriptomic Analysis:
- DESeq2: Recommended for mRNA-Seq DEG identification (identifies maximum DEGs with lowest false discovery rate)
- Pathway enrichment: Fisher's exact test or GSEA for biological interpretation
Multiplicity Correction: Apply Benjamini-Hochberg FDR correction for transcriptomic studies; Bonferroni for multiple biochemical endpoints.
5.4 Data Interpretation Guidelines
Clinical Translation Thresholds:
- ≥50% GC reduction: Minimal clinically meaningful response
- ≥80% GC reduction: Near-complete biochemical correction
- WT-level transcriptome: Full molecular normalization
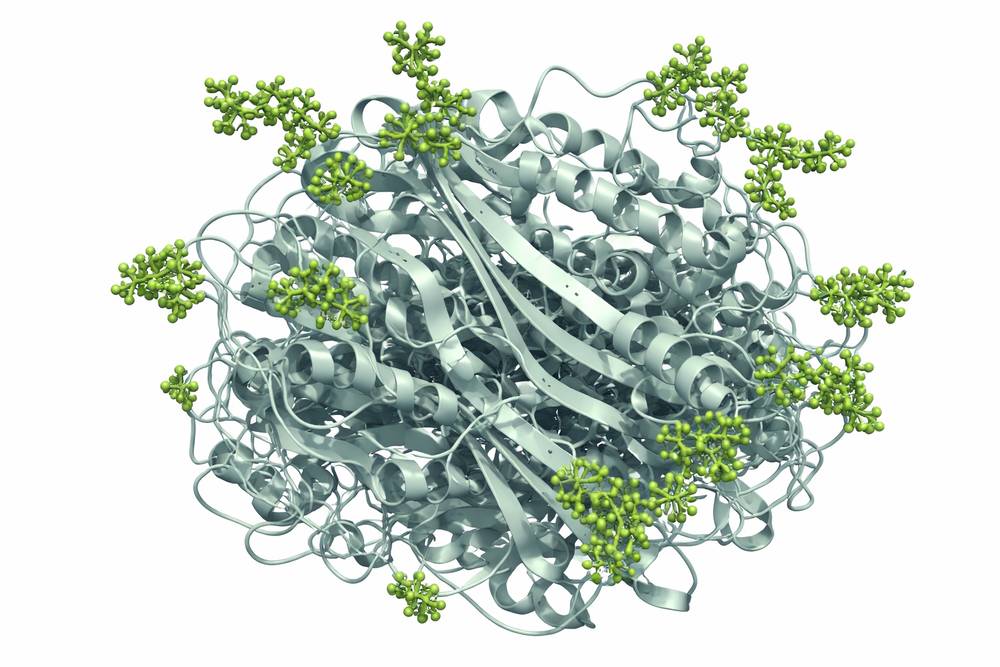
Fig 2. Three-dimensional structure of recombinant imiglucerase (PDB: 6TJJ) at pH 4.6, demonstrating the native folding and carbohydrate modification sites essential for macrophage mannose receptor recognition. Structure data from RCSB Protein Data Bank.
Conclusion
Successful imiglucerase experimental design requires careful integration of appropriate model selection, rational dose optimization, rigorous scheduling, comprehensive outcome assessment, and robust statistical planning. By adhering to these evidence-based guidelines and utilizing high-quality imiglucerase research products, investigators can generate translational data that advances our understanding of ERT mechanisms and informs clinical therapeutic strategies.
- The D409V/null mouse model provides the most robust platform for standard ERT studies
- Dose-ranging from 5-60 U/kg/week captures full pharmacodynamic profiles
- 8-week treatment duration achieves near-complete hepatic correction at high doses
- Multi-modal endpoints (biochemical + histological + transcriptomic) maximize mechanistic insight
- Immunogenicity monitoring is essential at doses ≥60 U/kg/week
For researchers embarking on ERT research methods development, these protocols establish the foundation for reproducible, publication-quality studies that advance the therapeutic landscape for lysosomal storage disorders.
References
1. Grabowski, G. A., et al. (2004). Enzyme therapy for Gaucher disease: the first 5 years. Blood Cells Mol Dis, 32(3): 363-369.
2. Pastores, G. M., & Hughes, D. A. (2019). Gaucher disease. In: GeneReviews. University of Washington, Seattle.
3. Xu, Y. H., et al. (2003). Generation and characterization of a mouse model of Gaucher disease. J Lipid Res, 44(6): 1197-1207.
4. Marshall, J., et al. (2002). Delivery of therapeutic levels of glucocerebrosidase to brain of mouse models of Gaucher disease. Proc Natl Acad Sci USA, 99(15): 10217-10222.
5. Weinreb, N. J., et al. (2012). Imiglucerase and velaglucerase alfa: pharmacokinetics and pharmacodynamics. Mol Genet Metab, 105(2): 233-240.
6. Benko, W., et al. (2018). Mouse models of Gaucher disease: Utility and limitations. Mol Genet Metab, 123(2): 91-98.
7. Grabowski, G. A., & Horowitz, M. (2019). Enzyme replacement therapy for Gaucher disease: Lessons learned and new challenges. Best Pract Res Clin Endocrinol Metab, 33(2): 151-173.
8. Schueler, U. R., et al. (2005). Long-term tolerance of enzyme replacement therapy in a murine model of type 1 Gaucher disease. Am J Hum Genet, 76(5): 853-864.